
Want to improve your investing skills? This guide shows 8 main differences between fundamental and technical analysis. These are two strong ways to look at investments. Knowing how they differ is key to making smart choices that fit your money goals. Whether you’re new to investing or have lots of experience, this comparison helps you pick the best method. You can even mix them for a smart market plan. Learn how each one uses different facts, time frames, and ideas about the market. Let’s get started.
1. Time Horizon and Investment Approach
Fundamental and technical analysis differ mainly in their time frames and how they guide investments. This difference affects how investors use each method, shaping their strategies, risk levels, and possible returns. Knowing this contrast is key for anyone in the financial markets.
Fundamental analysis looks at the long term, focusing on a company’s true value. It involves studying financial reports, industry trends, management, and the economy to find a company’s real worth. This process helps find undervalued companies that might grow over time. Investors often hold onto these investments for months or even years. Think of it as building a strong base for future success, with each step being careful research and smart choices.
Technical analysis focuses more on short to medium-term price changes. It uses charts and patterns to guess future price movements, without looking at a company’s actual value. This method can be used in different time periods, from seconds in fast trading to months in swing trading. Imagine riding market waves, making the most of short-term changes, and quickly adapting to shifts.
Each method uses different data and tools. Fundamental analysts study long-term financial predictions and economic data. Technical analysts look at short-term price charts and trends. These tools meet the unique needs of each approach.
For example, Warren Buffett’s long-term investment in Coca-Cola shows how fundamental analysis can help build wealth over time. On the other hand, day traders using 1-minute charts for currency trades show how technical analysis works for short-term gains. Pension funds planning for 30 years highlight the long-term nature of fundamental analysis. Meanwhile, swing traders using weekly charts for stock choices show the medium-term use of technical analysis.
The following infographic summarizes these key differences:
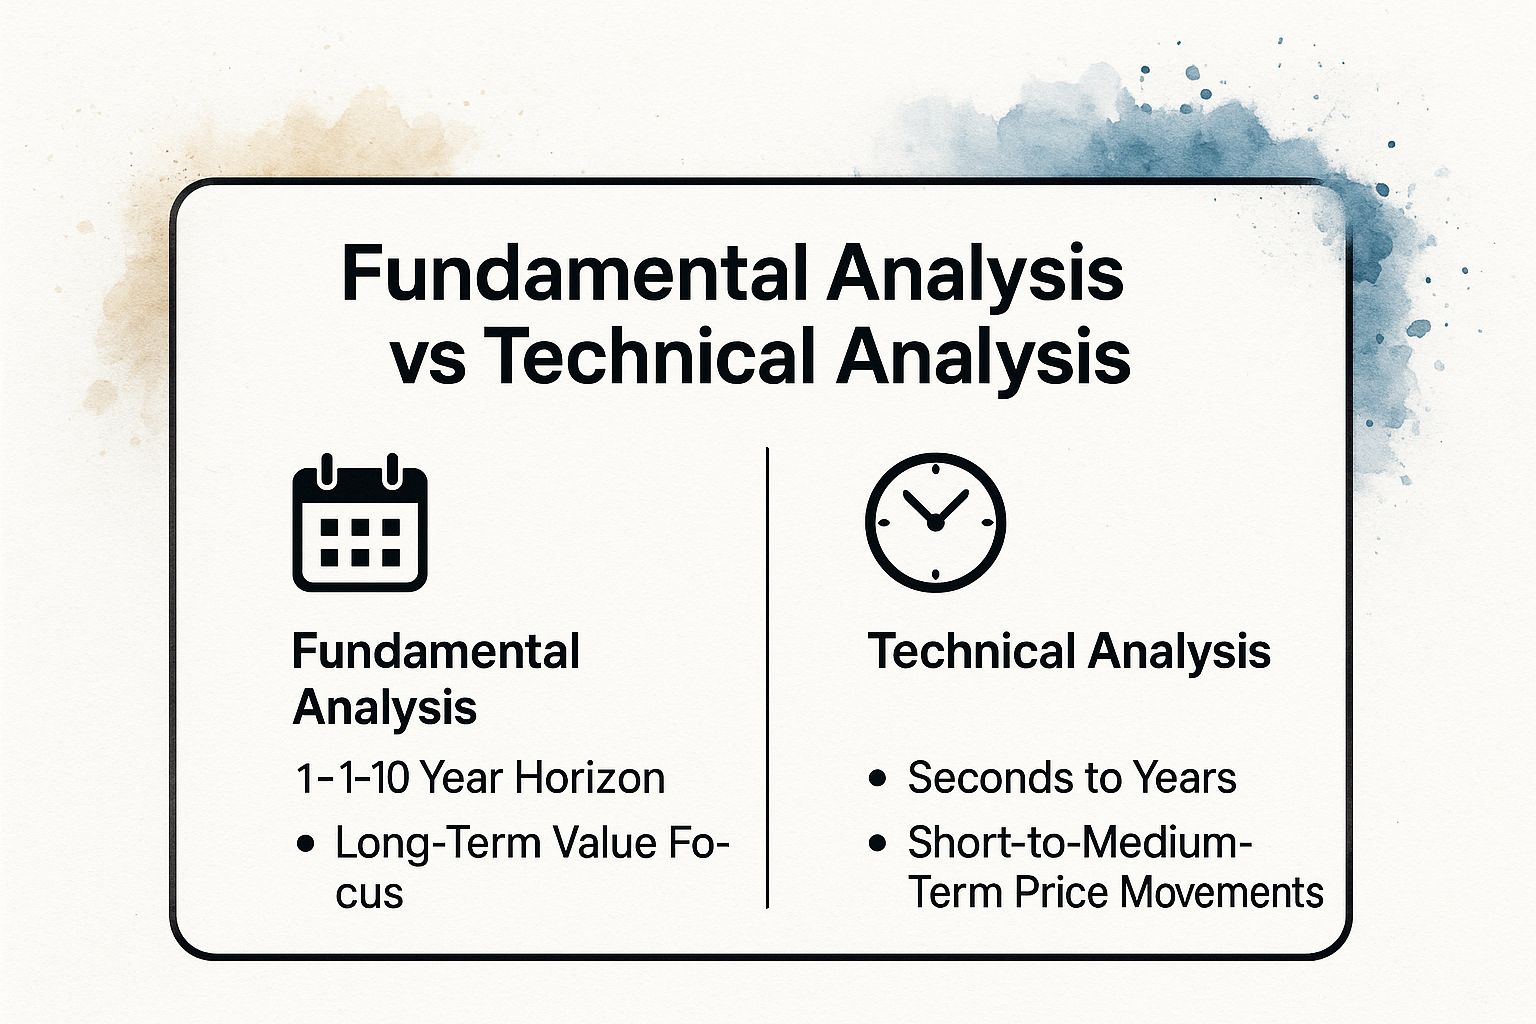
The infographic gives a quick look at the differences between fundamental and technical analysis. Fundamental analysis focuses on long-term value. It looks at investments over 1 to 10 years. On the other hand, technical analysis looks at short to medium-term price changes. This can be from a few seconds to several years. It is important to match your analysis method with your goals and time frame.
Each method has its own pros and cons. Fundamental analysis is steady and can handle market noise well. It is great for planning retirement and building wealth over time. But, it may miss short-term profit chances and react slowly to market changes. Technical analysis helps you make quick profits and manage risks. It lets traders take advantage of short-term market changes. However, it can give false signals and be affected by market tricks. It also needs constant watching.
To move through this field well, think about these tips:
Pick the right method for your investment timeline. Planning for retirement in 20 years? Use fundamental analysis. Looking for quick profits as a day trader? Technical analysis might work better.
Mix both methods for a better strategy. Use fundamental analysis to find good stocks. Then, use technical analysis to decide when to buy or sell. This mix uses the best parts of both methods.
Change position sizes based on your confidence in time frames. Take bigger positions for long-term investments. Use smaller positions for short-term trades.
By knowing the details of time frames and investment methods in fundamental and technical analysis, you can make smart choices, handle risk well, and reach your financial goals. Remember, pick the method that fits your goals and timeline best.
2. Data Sources and Information Types
The main difference between fundamental and technical analysis is found in their data sources and information types. This affects how each analysis is done and how investment choices are made. Knowing this difference is key to selecting the best approach for your investment aims. This section will look at the different data used in fundamental and technical analysis. It will help you understand investing better.
Fundamental analysis tries to find out how much a security is really worth by looking at economic and financial factors. It digs deep into a company’s financial health by checking its balance sheets, income statements, and cash flow. It’s like peeling an onion to see what’s inside. This way also looks at bigger things like GDP growth, interest rates, and industry trends to understand the investment scene. It also considers things like how good a company’s leaders are and its edge over others in the same field. This way helps investors understand a business and its growth chances.
Technical analysis thinks all needed info is already in the market price. It looks at past prices and volume, watching how market feelings change. Analysts use charts and patterns to spot trends and guess future prices. They think markets repeat themselves, and by studying old patterns, they can learn about future moves. Tools like moving averages and RSI are common for them. This method looks at market feelings and momentum quickly.
Choosing between the two depends on your investment style and time frame. Fundamental analysis is good for long-term investors who want to grow wealth slowly. They study a company closely and learn about its growth chances. This deep look can help find undervalued companies ready to grow. Technical analysis is liked by short-term traders who watch quick market changes. They enjoy spotting patterns and riding short-term price jumps. This fast analysis lets traders act quickly on market changes and possibly gain from short-lived chances.
Every method has its pros and cons. Fundamental analysis helps you understand a company’s true worth. It’s not easily influenced by market moods. But, it can take a lot of time and you might get too much information. Sometimes the data is old or incorrect. Technical analysis, on the other hand, gives a fast and visual view of market trends with up-to-date data. Yet, remember that past trends might not happen again, and ignoring basic company facts can be risky.
Here are some easy examples: When you look at Apple’s iPhone sales and how much they spend on new ideas, you’re using fundamental analysis. This shows how they innovate and their market position. If you examine Tesla’s daily price changes with candle charts, that’s technical analysis. It tries to guess short-term price changes based on past trends.
To improve your outcomes, keep these tips in mind: For fundamental analysis, check information from several trusted sources and watch for delays in data updates. For technical analysis, use clean and adjusted price data and try mixing different indicators to avoid mistakes.
The different styles of Benjamin Graham and David Dodd, who focused on value investing and fundamental analysis, compared to Charles Dow and his Dow Theory, which is key to technical analysis, show that both methods are still important. Whether you are new to investing, an experienced trader, or a financial expert, knowing the differences between fundamental and technical analysis helps you make smarter investment choices and face the ever-changing financial world with confidence.
3. Valuation Methods and Decision Criteria
A key difference between basic and technical analysis is their methods for valuing investments and making choices. Knowing these differences is vital for anyone wanting to succeed in financial markets. This section explores how each method decides if an investment is a good buy, sell, or hold.
Fundamental analysis tries to find out an asset’s true worth. It asks, “What is this asset really worth?” Analysts look closely at a company’s financial details, industry trends, competition, and bigger economic factors to figure out value. This true worth is then compared to the market price. If it’s much higher, the asset is seen as cheap and a good buy. If it’s lower, it might be overpriced, suggesting a sell.
There are different ways to value in fundamental analysis. Discounted Cash Flow (DCF) analysis predicts future cash and adjusts it to today’s value to find a business’s worth. Other tools include checking price-to-earnings (P/E) ratios, which look at a stock’s price versus its earnings, and book value analysis, which checks a company’s net assets. Comparing a company’s numbers to others in the same field also helps judge its value. For example, looking at the price-to-book ratios of several banks can show which are priced well or not. Think of using a DCF model to forecast Amazon’s future cash from its e-commerce and cloud services – that shows how fundamental analysis works.
Technical analysis, on the other hand, focuses solely on price and volume data. It operates under the assumption that market psychology and sentiment are reflected in price movements, and that history tends to repeat itself in the form of recognizable patterns. Technical analysts use charts, trend lines, support and resistance levels, and a plethora of indicators to identify trading opportunities. They look for patterns like “head and shoulders” or “double bottoms” that suggest potential price reversals. They also use momentum oscillators and moving average crossovers to gauge the strength of a trend and pinpoint optimal entry and exit points. Picture a cryptocurrency trader capitalizing on a breakout above a key resistance level – that’s technical analysis at play. Identifying a “golden cross” – where a shorter-term moving average crosses above a longer-term one – in the S&P 500 could signal a bullish trend and prompt a buy order for an index fund.
Each approach has its advantages and disadvantages. Fundamental analysis provides objective value estimates, offering a sense of grounding in the often turbulent world of investing. It’s also less susceptible to short-term market volatility, providing a long-term perspective. However, it relies on assumptions about future growth rates, which can be difficult to predict accurately. Furthermore, it assumes that markets will eventually reflect fair value, which may not always hold true in the short term.
Technical analysis can be very profitable, but it’s not always clear-cut. Reading charts and indicators isn’t an exact science. Different analysts might see different things in the same data. It can also give false signals, especially in confusing markets. Yet, it does a good job of showing market mood, which can affect short-term prices. Plus, by looking at price and volume, it helps find the best times to buy or sell, aiming to boost profits and cut losses.
The choice between fundamental and technical analysis highlights the need to pick the right method for your investment style and goals. If you’re a long-term investor wanting to grow wealth by owning solid companies, fundamental analysis might be your path. This approach is used by investors like Warren Buffett and Charlie Munger. If you’re an active trader looking to profit from short-term price changes, technical analysis might be better. This method is favored by traders like William O’Neil and John Murphy.
Whether you choose the careful valuation of fundamental analysis or the lively chart patterns of technical analysis, some tips can help. For fundamental analysis, use several valuation methods to get a fuller picture. Always keep a margin of safety for unexpected events. For technical analysis, check your signals with volume to see if there’s real buying or selling. Wait for clear signals before you act to avoid false moves.
In the end, knowing both fundamental and technical analysis can help you make smarter investment choices. It can give you more confidence to handle the ups and downs of the financial markets.
4. Market Efficiency Assumptions
The debate between fundamental and technical analysis centers on how well markets price securities. This difference in views influences the main ideas and methods of both approaches. Knowing these differences is important for anyone in the financial markets, whether new or experienced. It helps you choose the analysis method that matches your investment style and view of the market.
Fundamental analysis believes markets can be irrational. It considers that emotions like fear and greed can push prices away from their real value, sometimes for a long time. Fundamental analysts think they can find mistakes in pricing by studying a company’s finances, management, and industry. They see the market as a place where mistakes can lead to profit. They are willing to wait for the market to see the true value, hoping for big gains when that happens.
Technical analysis agrees with the idea that prices already show all known information. Technical analysts think looking at past price changes and market data is the best way to predict future prices. They believe that charts showing trends and patterns give important clues about what the market thinks a security is worth. This helps them react quickly to changes and benefit from new trends.
These different views on market efficiency affect how each method is used. For example, a value investor, who is a fundamental analyst, might study financial reports to find cheap stocks after a market drop, expecting prices to rise later. On the other hand, a technical trader might follow a trend during a bubble, taking advantage of rising prices even if they are too high. Contrarian investors, also fundamental analysts, might buy undervalued assets when the market is overly pessimistic. Meanwhile, momentum traders, using technical analysis, might stick with a strong uptrend, trusting the market’s view.
Features:
Fundamental: Markets can be irrational and inefficient; Inefficiencies create value opportunities.
Technical: Prices reflect all known information instantaneously; Trends and patterns reveal market consensus.
Pros:
Fundamental: Exploits market inefficiencies for profit; Can identify undervalued assets before market recognition.
Technical: Doesn’t require perfect information analysis; Adapts quickly to changing market conditions.
Cons:
Fundamental: May be wrong about market inefficiency timing; Markets can remain irrational longer than solvency.
Technical: Assumes market efficiency, which may not always hold; Efficient market periods reduce technical signal reliability.
Tips for Applying These Concepts:
Consider market conditions: Highly volatile or trending markets might favor technical analysis, while periods of uncertainty or market corrections could present opportunities for fundamental analysis.
Test your assumptions: Don’t blindly adhere to one approach. Continuously evaluate your assumptions about market efficiency based on empirical evidence and adjust your strategies accordingly.
Be prepared for extended periods of market irrationality: If you’re a fundamental analyst, acknowledge that markets can remain irrational for extended periods. Patience and a long-term perspective are essential.
Use risk management regardless of efficiency beliefs: No matter which approach you choose, robust risk management is paramount. Market fluctuations can impact any investment strategy, and proper risk management helps protect your capital.
Key people who have influenced the discussion on how markets work are Eugene Fama, Robert Shiller, Burton Malkiel, and Andrew Lo. Eugene Fama is known for his ideas on how markets are efficient. Robert Shiller points out that markets can have flaws. Burton Malkiel made the random walk theory well-known. Andrew Lo suggested the Adaptive Market Hypothesis, which mixes ideas of both market efficiency and flaws.
Choosing between fundamental and technical analysis is not about picking one as better. It is about knowing their basic ideas, seeing what each does well or poorly, and adjusting your plan to fit the market. By learning about how markets work, you can make smarter choices. This helps you handle the ups and downs of the financial world with more confidence.
5. Risk Assessment and Management Approaches
A key difference between fundamental and technical analysis is how they look at risk. Knowing these differences can help you make smarter investment choices and feel more confident in the market. It’s so important that it should be highlighted when comparing these two methods. Finding and reducing risks is central to successful investing, no matter what strategy you use.
Fundamental analysis dives into the true value of an asset. It closely examines financial reports, business methods, competition, and industry trends. The goal is to find the real value of a company, showing chances where the market price is lower than it should be. Risk is mainly judged by checking a business’s financial health. This includes looking at debt levels, credit scores, and how strong the business model is when facing challenges. Analysts also think about risks like changes in laws, world events, and how well managers do their jobs. For instance, a fundamental investor could have avoided Enron by spotting its unclear financial reports and high debt, which led to its failure. Similarly, analyzing loans before the 2008 crisis could have exposed risks in the subprime mortgage market, helping cautious investors avoid losses.
Technical analysis, meanwhile, looks at price changes and market patterns. It believes all known info is already in an asset’s price. Analysts use charts, patterns, and signals to find when to buy or sell, guess future prices, and manage risk. They use tools like volatility checks, drawdown studies, and price stops to limit losses. Position sizing is vital for technical traders, based on how much they trust chart patterns. A common rule is the 2% rule, which limits loss on a single trade to 2% of total trading money. This ensures that even several losing trades won’t hurt the portfolio too much. By focusing on price moves, technical analysts can quickly adjust risk settings as markets change, allowing them to stay flexible in changing conditions.
While both approaches offer valuable insights, they also have their limitations. Fundamental analysis, while excellent at identifying long-term business sustainability risks, can sometimes be slow to react to shifting market sentiment. It may underestimate the impact of short-term market fluctuations driven by fear or exuberance. Conversely, technical analysis, while offering precise entry and exit risk parameters, can be susceptible to whipsaw losses caused by false breakouts or sudden trend reversals. It may miss underlying fundamental deteriorations that haven’t yet manifested in price action.
Pros and Cons Summary:
|
Feature |
Fundamental Analysis |
Technical Analysis |
|---|---|---|
|
Risk Focus |
Business & Financial Risks |
Price-based Risks |
|
Risk Measures |
Debt ratios, credit ratings |
Volatility, drawdowns, stop-losses |
|
Pros |
Identifies long-term risks, considers qualitative factors |
Precise entry/exit, quick adaptation |
|
Cons |
Slow risk recognition, underestimates market sentiment |
May miss fundamental issues, whipsaw losses |
Tips for Effective Risk Management:
Diversification: Don’t put all your eggs in one basket. Diversify your portfolio across different asset classes, sectors, and geographies to mitigate the impact of any single investment’s failure.
Appropriate Position Sizing: Tailor your position size to your chosen analysis method and risk tolerance. Don’t overexpose yourself to any single trade.
Holistic Monitoring: Keep an eye on both fundamental and technical risk indicators. Integrating both perspectives can provide a more comprehensive view of the market.
Dynamic Adjustment: Be prepared to adjust your risk parameters as market volatility changes. Don’t be afraid to tighten stops or reduce positions during periods of heightened uncertainty.
The work of influential figures like Harry Markowitz (portfolio theory), Van Tharp (position sizing strategies), Nassim Taleb (tail risk awareness), and Ray Dalio (risk parity approaches) has significantly shaped modern risk management practices in both fundamental and technical analysis. By understanding the nuances of each approach, and by incorporating sound risk management principles into your investment strategy, you can navigate the complexities of the market with increased confidence and strive towards achieving your financial goals.
6. Market Psychology and Human Behavior Integration
A key difference between fundamental and technical analysis is their approach to market psychology and human behavior. Recognizing this distinction helps determine which method aligns with your investing or trading style, as markets are influenced by emotions like fear and greed, alongside logic and data.
Technical analysis acknowledges market psychology, using price patterns and indicators to reflect traders’ emotions. Tools like chart patterns and sentiment indicators, such as the put/call ratio, help anticipate price movements by understanding collective emotions.
In contrast, fundamental analysis focuses on business metrics, aiming to evaluate an asset’s intrinsic value apart from emotional market swings. It requires discipline to overlook short-term fluctuations, banking on the market’s eventual recognition of a company’s true worth. Value investing exemplifies this, often capitalizing on stocks undervalued due to market pessimism.
Both methods have limitations. Technical analysis can misinterpret market signals due to irrational behavior, while fundamental analysis can suffer from biases like confirmation bias. Ignoring market sentiment can also lead to missed opportunities or increased risk.
Understanding how each analysis method integrates market psychology offers valuable insights for strategic market participation.
Pros and Cons Summary:
|
Feature |
Technical Analysis |
Fundamental Analysis |
|---|---|---|
|
Market Psychology Integration |
Explicitly incorporates |
Attempts to overcome |
|
Pros |
Captures and profits from psychological extremes; Recognizes market irrationality as tradeable |
Less influenced by short-term emotional swings; Builds conviction through thorough analysis |
|
Cons |
Can be misled by false psychological signals; Requires emotional discipline |
May ignore important sentiment shifts; May miss opportunities due to psychological bias |
Tips for Incorporating Market Psychology:
Understand your own biases: Recognize your own emotional tendencies and how they might influence your investment decisions.
Use sentiment indicators as confirming factors: Employ sentiment indicators, like the put/call ratio or VIX, to support your analysis, whether technical or fundamental.
Develop emotional discipline: Regardless of your chosen approach, emotional discipline is crucial for long-term success in the markets.
Consider psychological factors in risk management: Incorporate potential market sentiment shifts into your risk management strategy.
By acknowledging the powerful influence of market psychology and integrating it strategically into your analytical approach, you can navigate the complexities of the financial markets with greater awareness and potentially improve your investment outcomes. The works of behavioral economists like Daniel Kahneman, Robert Shiller, Amos Tversky, and Jason Zweig offer invaluable insights into the intersection of psychology and finance and can further enhance your understanding of this crucial element of market analysis.
7. Hybrid and Integrated Approaches: Bridging the Gap Between Fundamental and Technical Analysis
Understanding the difference between fundamental and technical analysis is key for investors. Combining these approaches can unlock market potential by offering a comprehensive view of the market. Rather than seeing them as opposing methods, this approach highlights their complementary nature, leading to stronger investment frameworks.
The Combined Power of Different Analysis Methods:
Hybrid strategies work by using both fundamental and technical analysis. Fundamental analysis helps decide what to invest in, while technical analysis shows when to invest. Together, they help investors pick good stocks and find the best times to buy or sell. For example, an investor might find a company with strong finances using fundamental analysis (the what), and then use technical tools to decide the best time to buy the stock (the when).
These strategies can also include models that use both types of data. They show patterns and help make better investment choices. They work with different types of assets, making them flexible.
Examples of Hybrid Strategies:
Many successful strategies use this mix. William O’Neil’s CANSLIM method looks at company earnings and stock charts to find fast-growing stocks. Hedge funds often use research to identify cheap or expensive stocks and use technical analysis to time their trades.
Some models mix both types of factors to create varied portfolios that manage risk and aim for good returns. Even ETFs are using these strategies, combining different methods to lower risk and boost returns.
Advantages and Disadvantages of Hybrid Approaches:
The benefits of integrating fundamental and technical analysis are numerous. By leveraging the strengths of both approaches, hybrid strategies can reduce the weaknesses inherent in single-method strategies, providing multiple confirmation signals and adapting more effectively to different market conditions. This multi-faceted approach can lead to increased profitability and more consistent performance.
However, these strategies are not without their challenges. The increased complexity can make the decision-making process more demanding, requiring expertise in both fundamental and technical analysis. Conflicting signals between the two methods can also arise, requiring a clear hierarchy and decision-making framework. The sheer volume of data involved can sometimes lead to analysis paralysis, especially for less experienced investors.
Simple Tips for Using Hybrid Strategies:
If you’re eager to try hybrid strategies, here are some easy steps to follow:
Set Priorities: Choose which method is most important when there’s a conflict. This will prevent confusion and keep decisions steady.
Begin with Basics: Start with a simple mix of basic checks and timing before moving on to complicated methods.
Time Your Choices: Find strong companies, then use timing tools to decide when to buy or sell.
Test It Out: Use past data to see how your strategies work and spot any issues.
Hybrid strategies are a great way to grow in investing. They help you deal with market changes better. By knowing how to blend different methods, you can gain new insights and possibly earn more. These strategies help you make smart choices, adjust to changes, and improve your chances of success in the financial world.
8. Combining Fundamental and Technical Analysis: A Holistic Approach
Although often seen as opposites, fundamental and technical analysis can work together. By combining these two methods, investors can create a stronger strategy. This helps them understand market trends better. It also allows for more informed choices. Using both approaches covers each method’s weak points. As a result, it can lead to greater success in investing.

This approach acknowledges that market prices are shaped by economic factors and investor sentiment. Fundamental analysis examines an asset’s intrinsic value through earnings, revenue, debt, and industry trends. Meanwhile, technical analysis looks at price patterns, trading volume, and indicators to foresee trends. By combining these views, you achieve a clearer understanding of market dynamics.
Consider a company with strong fundamentals like consistent earnings growth and low debt. While fundamental analysis recommends it as a good investment, technical indicators showing an overbought stock might advise waiting for a price pullback. Conversely, a company with weak fundamentals might see a short-term price rise due to market hype, which a fundamental investor would avoid despite technical appeal.
To implement a combined strategy, first, conduct detailed fundamental analysis to find companies with strong value. Analyze financial statements, industry reports, and forecasts. Then, use technical analysis to identify optimal trade points by examining support and resistance levels, chart patterns, or momentum indicators. The aim is to find convergence where both analyses indicate a favorable opportunity.
Actionable Tips for Combining Fundamental and Technical Analysis:
Start with the Big Picture: Use fundamental analysis to identify promising sectors and industries. Then, drill down to individual companies within those sectors.
Identify Key Metrics: Focus on the fundamental factors that are most relevant to the specific asset class you’re analyzing. For stocks, this might include earnings per share, price-to-earnings ratio, and return on equity.
Time Your Entry and Exit: Use technical analysis to identify opportune moments to enter and exit trades. Look for breakouts, pullbacks, and other patterns that suggest a shift in momentum.
Manage Risk: Implement stop-loss orders to limit potential losses and protect your capital.
Be Patient and Disciplined: Successful investing takes time and patience. Stick to your strategy and avoid emotional decision-making.
Pros of Combining Fundamental and Technical Analysis:
More Robust Investment Strategy: Leverages the strengths of both approaches.
Improved Risk Management: Provides a more complete understanding of market dynamics.
Increased Probability of Success: Offers a more holistic perspective on investment opportunities.
Cons of Combining Fundamental and Technical Analysis:
Time-Consuming: Requires significant research and analysis.
Complex: Can be challenging to master both disciplines.
Requires Discipline: Demands adherence to a well-defined strategy.
This combined approach deserves its place in this list because it represents the evolution of investment analysis. By embracing both fundamental and technical perspectives, you can develop a more nuanced and sophisticated approach to navigating the complexities of the financial markets. This holistic strategy empowers investors to make more informed decisions, manage risk effectively, and ultimately achieve their financial goals. While it requires more effort and dedication, the potential rewards of this integrated approach are well worth the investment. By combining the power of fundamental and technical analysis, you can unlock a deeper understanding of the market and position yourself for long-term success in the exciting world of investing. The difference between fundamental and technical analysis becomes a synergy when used together.
8-Method Analysis Comparison
|
Aspect |
Fundamental Analysis |
Technical Analysis |
Hybrid/Integrated Approaches |
|---|---|---|---|
🔄 Implementation Complexity |
Moderate – requires financial knowledge and modeling |
Moderate to High – needs charting tools and pattern recognition skills |
High – combines strengths of both, needs multidisciplinary expertise |
|
⚡ Resource Requirements |
High – access to financial reports, economic data |
Moderate – requires real-time price and volume data |
High – requires comprehensive data and advanced tools like AI |
|
📊 Expected Outcomes |
Long-term intrinsic value identification |
Short- to medium-term price action insights |
Balanced – security selection plus timing optimization |
|
💡 Ideal Use Cases |
Long-term investing, retirement portfolios |
Day trading, swing trading, market timing |
Professional investing, quantitative models, sector rotation |
|
⭐ Key Advantages |
Less affected by market noise; deep business understanding |
Captures market psychology; quick decision-making |
Leverages both methods; multiple confirmation signals |
Making the Right Choice: Fundamental, Technical, or Both?
Knowing the difference between fundamental and technical analysis helps you understand the financial markets better. We’ve looked at their main differences, like how long they focus on, where they get information, and how they view risk and market behavior. Fundamental analysis checks a company’s true worth. On the other hand, technical analysis looks at price movements and trends. Learning these ideas helps you make smart investment choices, whether you invest for the long run or trade in the short term. Often, using both methods together is best. You get the benefits of each and see the market clearly. This helps you change with the market and improve your strategies. By using these tools, you can handle the market’s ups and downs and work towards your money goals.
Want to use what you’ve learned and see how both analyses work? Stock Decisions (https://yourwealthsignal.com) gives you the information you need to do both well, helping you make smart investment choices. Check out Stock Decisions today and boost your investing skills.