
Understanding Stock Volatility Without The Confusion

Calculating stock volatility is important for investors who want to understand the financial markets. But what is volatility? It simply shows how much a stock’s price moves over time. A stock with high volatility has big price changes, causing excitement and worry. A stock with low volatility changes more smoothly.
Why Volatility Matters
Volatility can be good or bad. It’s a key part of the market. Some investors view high volatility as risky. Others see it as a chance. Many successful investors use high volatility to their benefit. They buy when prices drop and sell when they rise, making the most of market changes.
What Drives Volatility?
Many things cause stock volatility. News about a company, like earnings reports or new products, can change a stock’s price. Larger economic issues, like interest rate changes or inflation, also affect it. Global events can change the market too. A good earnings report can make a stock jump, while an economic downturn might cause a market drop.
Different Types of Volatility
Volatility acts differently in different situations. During calm times, volatility is often lower. But during uncertain or crisis times, it can rise fast. Knowing how to read volatility in the market is important. The VIX, also known as the “fear index,” is used to check market volatility. It shows the expected changes of the S&P 500.
Applying Volatility to Your Investments
Understanding volatility is more than just numbers. It’s about making smart investment choices. By looking at stock volatility, you can see the risks and rewards of investments. This helps you build a balanced portfolio, manage risk, and find good opportunities. In the end, knowing about volatility can lead to better investment results.
Step-By-Step Methods To Calculate Stock Volatility
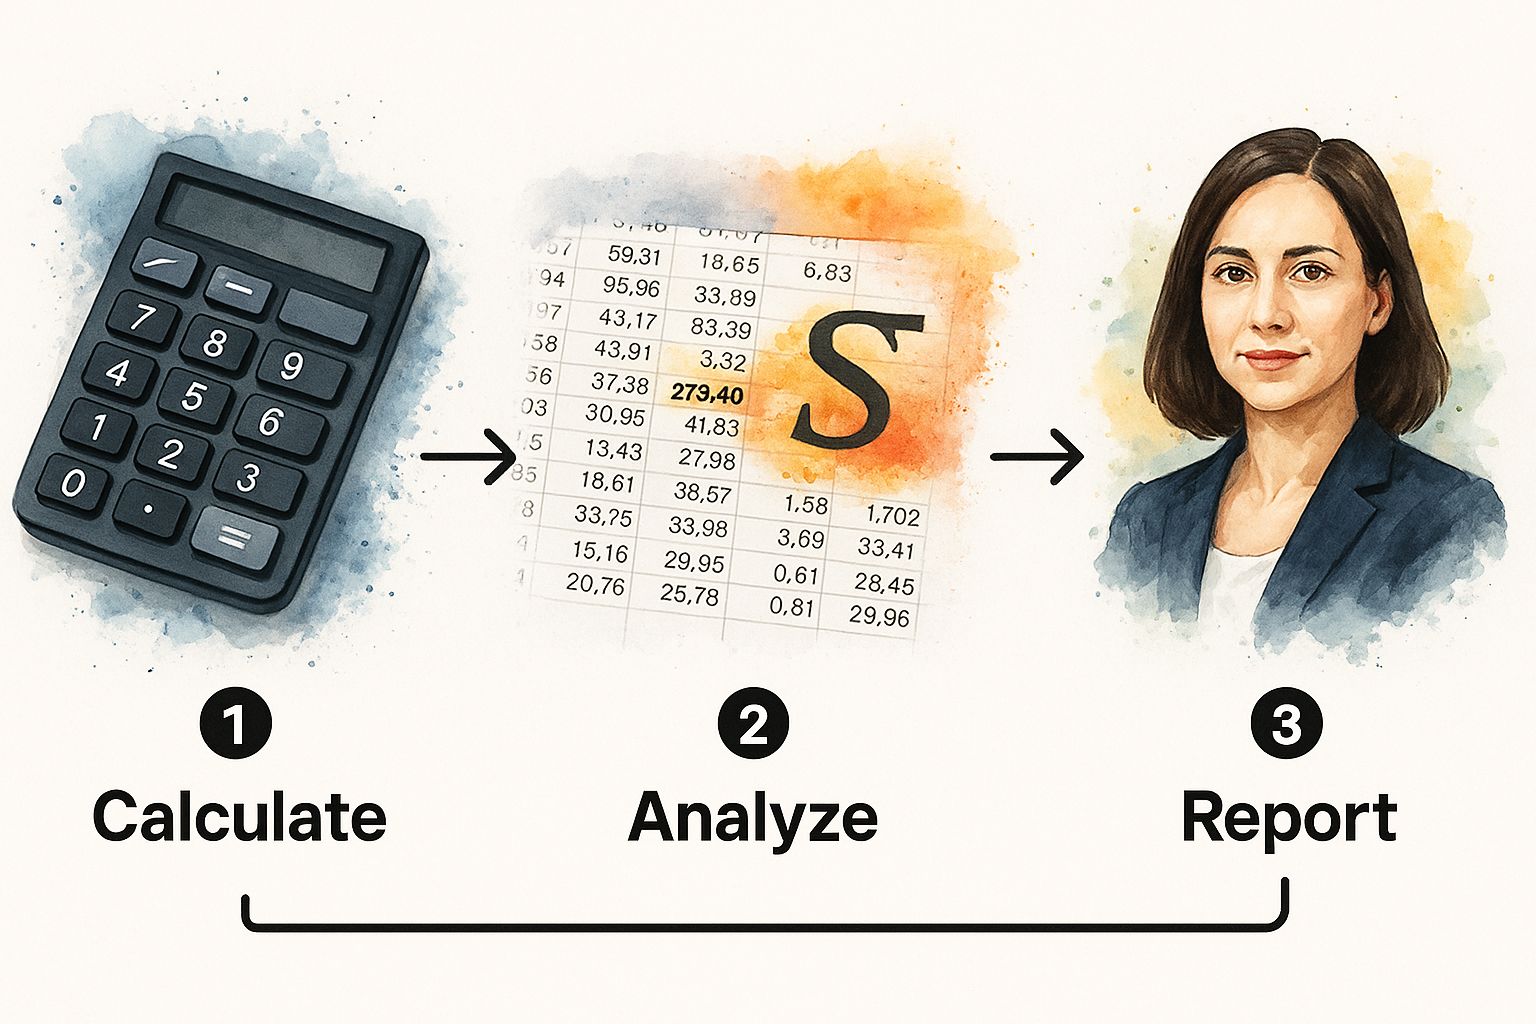
This infographic shows how to figure out stock ups and downs. Notice the main parts: a calculator, a spreadsheet, and the sigma (σ) symbol, which stands for standard deviation. Watercolor highlights point out key numbers in the spreadsheet, showing their part in the math. The main point? These tools work together, with standard deviation (σ) being key to understanding market ups and downs.
Figuring Out Standard Deviation
Want to know about stock ups and downs? A common way to figure it out is by using standard deviation. This tells us how much a stock’s price moves away from its average price. A bigger standard deviation means more price changes and higher ups and downs.
Get past price data: First, gather the stock’s closing prices for a set time. This could be 20 days, 50 days, or a year (252 trading days). Websites like Stock Decisions offer easy access to this info for popular stocks like GOOGL, MSFT, AMZN, AAPL, META, and NVDA.
Find daily changes: Next, calculate the percentage change from one day to the next. Use this formula:
[(Closing Price Today - Closing Price Yesterday) / Closing Price Yesterday] * 100.Find average daily change: Add all the daily changes and divide by the number of days. This gives you the average daily change.
Find variance: Now, for each daily change, subtract the average daily change and square the result. Add up these squared differences and divide by the number of days minus 1. This is the variance.
Find the standard deviation: Lastly, take the square root of the variance. This is your daily standard deviation.
Understanding Annual Changes
Daily ups and downs are shown by standard deviation. To see the yearly pattern, multiply this by the square root of the trading days in a year (about 252). This helps you compare changes over time and with different stocks.
Exponentially Weighted Moving Average (EWMA)
Looking for a quicker way to measure? The Exponentially Weighted Moving Average (EWMA) focuses more on recent price changes. It puts less importance on older data. This is helpful for stocks like GOOGL and META, which are often affected by the news. By using a smoothing factor (lambda) of 0.94, recent prices matter more in figuring out changes.
Using Spreadsheets and Tools
Spreadsheets like Excel and Google Sheets are great for these calculations. They have functions and formulas to make the process easier. Websites like TradingView and Yahoo Finance offer ready-made data, saving time. Stock Decisions gives you easy-to-use insights directly.
By learning these ways, you’ll gain skills to see and understand stock changes. This helps you make smarter choices when investing.
Realized Vs. Implied Volatility: What Actually Matters

Understanding stock volatility is about more than looking at past price changes. It’s also about predicting what’s next. Knowing the difference between realized volatility and implied volatility is key for smart investing.
What Are Realized and Implied Volatility?
Realized volatility shows how much a stock’s price has changed over a certain time. It tells us about past movements. Implied volatility, though, looks ahead. It shows what the market thinks will happen, based on options prices.
Realized volatility gives us clues about market stability. It shows us how much a stock’s price has really moved in the past. For example, during the late 1980s bull market, two-week realized volatility jumped from 8% to 15%. This hinted at coming trouble, like the big drop in stock prices on Black Monday in October 1987.
How Implied Volatility Affects Options Prices
Implied volatility is key in setting options prices. When implied volatility is high, option premiums are high too. This is because the market expects big price movements, which means more chances to gain or lose. So, options that let you join in these swings cost more.
Think of two call options on the same stock. If one has higher implied volatility, it will cost more. This is because people expect bigger price changes. For options traders, knowing about implied volatility is really important.
Spotting Opportunities With Volatility Spread
The gap between realized and implied volatility can show trading chances. If realized volatility is much lower than implied, the market might be overestimating future swings. This could be a chance to sell options, making money from high premiums.
But if realized volatility is much higher than implied, the market might be underestimating future moves. This might be a good time to buy options at lower prices.
Understanding Real-World Scenarios
Think about a stock that usually has low volatility. If the expected volatility suddenly rises because of an upcoming earnings report, this change might be a chance to act. Selling options can help you gain from the higher premiums caused by this spike in expected volatility.
On the other hand, consider a stock with very high volatility due to sudden market events. If the expected volatility is lower, buying options might be smart. The premiums could be cheaper than they should be. By looking at this volatility difference, you can spot possible pricing errors and make better trading choices.
Understanding The VIX And Other Volatility Measures
Understanding stock market volatility is like steering a ship through changing seas. You need the right tools to predict storms and calm waters. Volatility measures are those tools, giving insights into market feelings and possible price changes.
Understanding the VIX: The “Fear Gauge”
The Cboe Volatility Index (VIX), often called the “fear gauge,” is an important measure of what the market expects for short-term volatility. It shows the market’s mood, predicting how much the S&P 500 Index might change in the next 30 days. The VIX comes from the prices of S&P 500 index options and gives a clear picture of market uncertainty. It started in 1993, based on the S&P 100 Index, and is now a key tool for investors trying to understand market behavior. A high VIX usually means more worry in the market, while a low VIX suggests the market is calm. For more background, check out the Cboe VIX Historical Data.
Beyond the VIX: Looking at Other Volatility Indices
The VIX is a useful tool, but it’s not the only one. There are other indices that track different markets and sectors. These indices provide unique views of market changes.
VIX9D: Looks at the expected changes in the S&P 500 over the next 9 days.
VXN: Focuses on the Nasdaq 100, which is full of tech companies. It shows how much this market might change.
VXD: Follows the Dow Jones Industrial Average. It watches the changes in 30 major companies.
VSTOXX: Measures changes in European markets. This is important for those investing internationally.
These indices help investors see how different parts of the market behave.
Using Volatility Indices for Investing
Volatility indices offer more than just numbers; they provide helpful insights. By understanding them, you can make better plans for your investments.
When the VIX is high, it might be wise to protect your investments or sell risky assets. On the other hand, if the VIX is low, it might be a good time to buy, especially if you can handle some risk. Using this info with tools like Stock Decisions, which might use volatility data, can help you see market trends more clearly.
Spotting Market Turning Points
In the past, extreme VIX numbers often matched big changes in the market. Spikes in the VIX usually happen during market corrections or crashes. These show increased fear and uncertainty. However, these times can also offer good chances for long-term investors. On the flip side, very low VIX numbers can sometimes come before times when the market is too relaxed. This might increase the risk of surprises. By looking at the VIX along with other market signs, you can get a better understanding of possible risks and chances.
Tools And Software That Actually Work For Volatility Analysis
Calculating stock volatility is essential for informed investing. Manually crunching the numbers can be a daunting task. Thankfully, a variety of tools and software exist to simplify the process, ranging from familiar spreadsheets to powerful financial platforms. Let’s explore some popular options for navigating this crucial aspect of market analysis.
Easy and Free Tools
You can study stock ups and downs without fancy software. Programs like Excel and Google Sheets have built-in tools to help you. Just enter past price data, find daily returns, and use formulas like STDEV.S for sample standard deviation or STDEV.P for population standard deviation.
These tools are a great place to start learning about market changes.
Excel: Microsoft Excel lets you use formulas and make your own functions.
Google Sheets: Google Sheets allows for teamwork and is easy to use online.
With these, you can make your own systems to watch market changes. Many websites have templates and ready-made formulas to help you. This way, you can focus on the results instead of difficult math.
Advanced Platforms
For deeper insight, try platforms like TradingView and Yahoo Finance. They provide pre-made data, charts, and tools for understanding market shifts.
TradingView: TradingView offers many chart tools and live data to see trends.
Yahoo Finance: Yahoo Finance gives free access to important data and past stock prices.
These platforms make it easier to understand market changes by showing data together. They are helpful but might not offer as much detail or custom options as special finance software. For example, some advanced methods might not be available.
Top Financial Tools
Investors who want the best tools should check out platforms like the Bloomberg Terminal. This tool gives access to lots of past and current market data, smart analytics, and special calculations.
- Bloomberg Terminal: It provides a lot of data, analysis, and timely market news for professional investors.
The Bloomberg Terminal has advanced features for detailed analysis of different asset types. But it is quite expensive, so it’s not easy for individual investors to access.
Using Financial APIs
For those who need more personalization, financial APIs are a great choice. These interfaces give direct access to real-time market data from various sources, such as stock exchanges. You can then add this data into tools you build yourself.
- Financial APIs: Many companies offer financial APIs, allowing direct data access and easy integration with your own systems.
However, using APIs often requires programming skills and extra support.
To help you compare these options, let’s look at this table:
Volatility Analysis Tools Comparison
A comprehensive comparison of popular tools and platforms for calculating stock volatility, including features, costs, and best use cases.
|
Tool/Platform |
Cost |
Key Features |
Best For |
Limitations |
|---|---|---|---|---|
|
Excel/Google Sheets |
Free |
Basic formulas, custom functions |
Beginners, individual investors |
Limited data, basic calculations |
|
TradingView |
Freemium/Paid |
Charting tools, real-time data, indicators |
Intermediate traders, technical analysis |
Data limitations, potential cost for premium features |
|
Yahoo Finance |
Free |
Historical data, basic financial information |
Casual investors, quick analysis |
Limited advanced features |
|
Bloomberg Terminal |
Paid (expensive) |
In-depth data, advanced analytics |
Institutional investors, professionals |
High cost |
|
Financial APIs |
Variable |
Direct data access, custom integration |
Advanced users, custom applications |
Requires programming knowledge |
This table summarizes the key features, cost, and ideal user profile for each tool, helping you choose the best fit for your needs. From free spreadsheets to premium terminals, there’s a tool for every investor.
Stock Choices: Understanding Volatility
Platforms like Stock Decisions make it easier to look at stock volatility. They have tools that help you see how much a stock’s price might change. By looking at this along with other important numbers, investors can make better choices.
Picking the Right Tool
The best tool for checking stock swings depends on what you need. If you’re new, a simple spreadsheet might work. Experienced traders might like more advanced platforms or special tools. Bigger investors often use fancy systems. No matter your skill level, knowing how to use this data is key to dealing with the market.
Using Volatility to Make Smart Investments
Learn how stock price changes can help you grow your money. This guide shows how top investors use these changes to decide when to buy or sell and keep their investments safe.
Reading Volatility Signals
Price changes aren’t just fast movements. They tell a story. High changes can mean big chances or risks. For example, during uncertain times, the CBOE Volatility Index (VIX) often goes up. This can be a good time to invest for the long haul if you’re ready for short-term swings. But if a stock suddenly changes a lot after being calm, it’s wise to be careful. The trick is to see what these changes mean in the big picture.
Balancing Different Assets
Good investing means mixing safe and risky assets well. Think of it like building a house: you need a strong base (safe assets) and exciting parts (risky assets) for strength and growth.
Safe assets, like bonds or big company stocks, help during bad market times.
Risky assets, like new stocks or stocks in growing markets, might earn more but are riskier.
Finding the right mix is important. It should fit how much risk you can handle, how long you plan to invest, and what’s happening in the market. A portfolio with too many risky assets can lose a lot in market drops. But one with too many safe assets might miss out on big gains. Stock Decisions can help you look at your asset mix and make changes if needed.
Volatility-Based Entry and Exit Strategies
Seasoned traders employ volatility thresholds as triggers for precise entry and exit criteria. For example, a trader might implement a volatility-based stop-loss order, automatically exiting a position if volatility surpasses a predetermined level. This strategy helps curtail potential losses during periods of heightened market turbulence. In contrast, some traders view declining volatility as a buy signal. If a stock’s volatility dips below a specific threshold, it might suggest an undervalued asset poised for a potential rebound.
To understand how volatility levels can influence investment strategies, let’s look at the table below:
Volatility Levels And Investment Implications: A practical guide showing what different volatility ranges typically indicate for investment decision-making across various market conditions
|
Volatility Range |
Market Condition |
Typical Interpretation |
Investment Implication |
Risk Level |
|---|---|---|---|---|
|
Low |
Stable, predictable |
Reduced uncertainty, potential uptrend |
Consider increasing exposure to equities |
Low |
|
Moderate |
Gradual trending |
Potential for continued growth or decline |
Monitor market indicators and adjust accordingly |
Medium |
|
High |
Uncertain, volatile |
Increased risk, potential for large swings |
Consider hedging strategies, reduce exposure |
High |
|
Extremely High |
Market correction/crash |
Significant uncertainty, potential downturn |
Preserve capital, seek safe haven assets |
Very High |
This table provides a general framework. Remember that interpreting volatility effectively requires a comprehensive assessment of various market factors, economic data, and company-specific news.
Practical Portfolio Examples and Case Studies
Let’s examine how volatility plays out in real-world scenarios. Consider a portfolio manager navigating a market downturn. By analyzing the volatility of different asset classes, they can pinpoint those most vulnerable to further declines. This analysis can inform decisions to reduce exposure to those assets and shift towards more stable investments.
Conversely, during a bull market, a manager might use volatility to identify high-growth potential stocks. By studying volatility patterns, they can potentially uncover opportunities in undervalued stocks, capitalizing on future price appreciation. Stock Decisions can be a valuable resource for gaining these insights.
By understanding and applying these strategies, investors can transform volatility from a source of apprehension into a valuable compass for informed decision-making.
Key Takeaways For Understanding Volatility
This section is a helpful guide for adding stock volatility analysis to your investment plan. We’ll cover basic calculation methods, point out useful tools, and give simple steps for making smart choices based on volatility. Each point includes steps you can take, clear goals, and warnings to help you avoid mistakes.
Calculating Volatility
Knowing how to calculate stock volatility is important. Volatility shows how much a stock’s price moves over time. Here’s a brief look at the main methods:
Standard Deviation: This method shows how spread out a stock’s price is from its average. A larger number means more volatility. Make sure to adjust the daily number by multiplying it by the square root of 252 (the usual number of trading days in a year).
Exponentially Weighted Moving Average (EWMA): This method focuses more on recent price changes, making it quicker to reflect current market conditions. It’s useful during fast changes.
Realized vs. Implied Volatility: Realized volatility looks at past price changes, while implied volatility shows what the market thinks about future changes. Knowing the difference can help find trading chances. A big gap between them might show the market is not pricing options correctly.
Tools for Volatility Analysis
The right tools can make analyzing volatility easier. Spreadsheets like Excel and Google Sheets are simple yet effective for tracking volatility. Platforms like TradingView and Yahoo Finance offer ready-made data and charts. For more in-depth analysis, the Bloomberg Terminal is an option, though it can be costly. Financial APIs give more room for custom analysis but usually need coding skills.
Using Volatility Data
Knowing about volatility is just the start; the real value is in how you use it. Here’s how you can apply it to make better investment choices:
Position Sizing: Use volatility to choose the right size for your investments. High volatility might need smaller investments to manage risk. For instance, if you invest in two stocks, one with high volatility and another with low volatility, putting more money into the less volatile stock could reduce losses in a downturn.
Timing Entries and Exits: Volatility can help find good times to buy or sell. A big jump in volatility could mean it’s time to sell, while a period of calm might be a good time to buy. Imagine a stock that drops a lot with a spike in volatility; this might be a signal to lower your stake.
Risk Management: Checking volatility is key for managing risk. Spreading your investments across assets with different volatility levels is essential. For example, investing part of your money in low-volatility bonds can balance out losses from high-volatility stocks during market changes.
Staying Informed
Keeping up with volatility trends is crucial for successful investing. Regularly check volatility indices, like the VIX, for insights into market feelings. Volatility can shift quickly, so staying informed is important.
Make Better Choices with Stock Decisions
Want to understand volatility better and boost your investment strategy? Stock Decisions (https://yourwealthsignal.com) offers the tools and knowledge you need to analyze volatility effectively. With detailed financial data and real-time updates, Stock Decisions helps you make confident, data-based choices. Start unlocking your investment potential today!