
Why Everyone Gets Earnings Reports Wrong
Let’s face it, many investors quickly scan earnings reports like they do with the morning news. They spot the big revenue number and the earnings per share (EPS). Then they think they understand it all. But that’s like judging a book by its cover. You’re missing what’s inside. I’ve talked to experienced portfolio managers, and they do things differently. They dive deep.
These experts don’t start with the main numbers. They look into the details: the balance sheet, the cash flow statement, and management’s discussion and analysis. This is where true insights are found. Think of it like solving a mystery—you don’t just glance at the scene. You search for clues, context, and the hidden story. Knowing how to read these reports well gives you a real advantage.
Finding Hidden Truths: Beyond the Big Numbers
Here’s a common mistake: we focus on what’s easy to see—those main numbers. But they can trick you. Companies can tell a story, showing certain numbers while hiding important details deep in the report. It’s like an iceberg—the big numbers are just the top. The real stuff, the key information, is below the surface.
For example, a company might say it has great revenue growth. But when you check the cash flow statement, it might show something else. Maybe customers aren’t paying, so cash isn’t actually coming in. Or maybe the growth comes from buying other companies, not from growing on its own. That’s a big deal for long-term investors. Timing counts too. Stock exchanges have schedules for reports, and in Q1 2025, 78% of S&P 500 companies beat EPS estimates. If you want to understand more, knowing the market context helps you read these reports better.
The Importance of Context and Critical Thinking
The real value is often in the small details. Footnotes, for example. They can show important information: money owed, pending legal issues, or changes in accounting that can greatly affect a company’s finances. Skilled analysts look closely at these small details. They’re like an early warning sign of potential problems.
This is why closely examining earnings reports matters. It’s about building a critical mindset. Question everything. Look deeper. Find the story behind the numbers. That’s how you make smart investment choices. It’s about seeing the whole picture, not just part of it.
Reading Income Statements Like a Detective
Let’s be honest, revenue growth can sometimes be misleading. It might look great at first, but what if it’s due to purchases of other companies and not real sales? Or those strong profit margins? They lose appeal if they come from one-time asset sales instead of real business improvements. That’s when we need to think like detectives and dig into financial statements. This is how you tell the beginners from the experts when understanding earnings reports.
Beyond the Headlines: Finding the Real Story
Imagine a company says it has a 20% revenue boost. Time to celebrate, right? Not so fast. If this jump comes from buying another company, it’s not real growth. It doesn’t show how the current business is doing. I’ve seen this before. I looked at a company that talked about big revenue growth for years. But their main product sales were going down. They were hiding it by buying smaller rivals. The truth came out, and their stock fell.
Another trick is changing profit margins. A company might sell a property and call the gain operating income. This makes their margins look better. But it doesn’t show true profits. We want to see what really drives profit, not tricks with numbers.
GAAP vs. Non-GAAP: Understanding the Details
Know this difference: GAAP (Generally Accepted Accounting Principles) earnings and non-GAAP earnings. Companies like to show non-GAAP numbers. Why? They often leave out “one-time” costs, making things look better. Be careful, as those charges might come back. Always check both GAAP and non-GAAP numbers to see the full picture. It’s like seeing a photo with and without a filter – you need the real view to know what’s happening.
Key Ratios: Understanding What Matters Most
Beyond the main numbers, some profit ratios help you understand earnings reports better. The gross profit margin shows how well a company makes its products or services. The operating margin tells you how well managers control costs. The net profit margin is the final profit after all costs are paid. Watching these ratios over time helps you see trends and spot issues early.
Now, let’s look at this table to see what companies highlight versus what you should focus on:
Key Income Statement Metrics and What They Show
|
Metric |
What Companies Emphasize |
What Investors Should Focus On |
Why It Matters |
|---|---|---|---|
|
Revenue Growth |
Overall percentage increase |
Organic revenue growth (excluding acquisitions) |
Shows the true health of the core business |
|
Profit Margins |
Non-GAAP earnings, excluding “one-time” items |
GAAP earnings, including all expenses |
Reveals sustainable profitability |
|
Earnings per Share (EPS) |
Non-GAAP EPS, often adjusted higher |
GAAP EPS, reflecting actual earnings |
Provides a realistic view of earnings power |
|
Operating Income |
May include gains from non-operating activities |
Operating income from core business operations |
Isolates profitability from the company’s main activities |
As you can see, focusing on the right metrics helps you see past the surface and understand the underlying strength of the business.
Understanding Earnings Reports: Look Beyond the Surface
Focus on the words used in earnings reports and meetings. Does the management sound sure, or are they uncertain? Do they give clear plans for the future, or do they keep things vague? Once, I looked at a company whose leaders kept saying “tough market” and “obstacles.” I felt something was wrong, and the next quarter’s results were very disappointing.
Asking the Right Questions: Think Like a Detective
If something seems too good to be true, it often is. Don’t be afraid to dig deeper. Here are some questions to ask:
Where is the revenue growing? From regular sales or buying other companies?
Are the profit margins lasting, or just due to one-time events?
What’s the difference between the official numbers and the adjusted ones, and why?
How do key profit numbers change over time?
What does the management’s tone say about their confidence?
By thinking like a detective and asking these questions, you see past the hype and get the real story. This is how you get an edge in the market. It helps you go from just reading reports to truly understanding the business. This is crucial when learning to read earnings reports.
Balance Sheet Truths That Predict the Future

While everyone’s glued to the quarterly earnings reports, I’ve learned something crucial over the years: the balance sheet offers a much clearer glimpse into the future. It’s the real key to understanding if a company will be thriving in five years, not just surviving the next quarter. Think of it this way: the income statement shows you the party upstairs, but the balance sheet reveals the foundation the house is built on.
Decoding Liquidity: Can the Company Pay Its Bills?
One of the first things I look at on a balance sheet is liquidity. This tells you how easily a company can pay its short-term debts. It’s a simple concept: Can they cover the bills coming due? You’re essentially comparing current assets (cash and things that can quickly become cash) against current liabilities (upcoming bills).
The current ratio (current assets divided by current liabilities) is your quick-check metric here. A ratio of 1.5 or higher is generally considered healthy, although this can change depending on the industry. A ratio below one? That’s a yellow flag worth investigating. Imagine a company with a current ratio of 0.8. They might be playing a dangerous game of catch-up with their bills. Now, picture a company with a 2.5 current ratio. They have a comfortable cash cushion, which provides flexibility and stability.
Working Capital: Revealing Operational Efficiency
Let’s talk about working capital. This is the gap between what a company owns now and what it owes soon. Think of it as the gas for daily business activities. When working capital goes up, it might mean the company is running well and getting better. But if it goes down, there could be problems.
For instance, if accounts receivable (money the company should collect) grows fast while sales stay the same, it’s a warning. It could mean they have trouble getting paid. Likewise, if their inventory rises, it might mean fewer people want their products. These clues are important and don’t show up on the income report.
The Debt Challenge: Understanding Financial Risk
The balance sheet also shows a company’s debt situation. How much do they owe, and what kind? This tells us how at risk they are if interest rates go up or if the economy gets shaky. A lot of short-term debt is risky because it needs frequent refinancing, often at changing rates. A company may seem profitable now, but too much debt can cause big trouble if things change.
I’ve seen it happen. I once checked a company with great profits. But their balance sheet showed heavy debt. When interest rates went up, their profits disappeared due to high interest costs, and their stock dropped.
Case Studies: From Failures to Hidden Gems
Studying company financials, especially those that surprised people, teaches important lessons. Some companies looked great by profits alone but failed due to weak financials. However, I’ve found some real treasures by spotting companies with strong financials that seized market chances.
Watch changes in stock and payments owed. These can warn early. Rising stock compared to sales might mean less demand. Falling payments owed could show better payment collection. These changes can predict future success.
Learning to read financials is key for any investor. It’s not just about numbers; it’s about understanding what those numbers say about a company’s real financial health and future.
Cash Flow: Where Companies Can’t Hide the Truth
Let’s face it, companies can sometimes make their earnings look better with accounting tricks. But the cash flow statement is different. It’s much harder to change. That’s why I, along with many other experienced investors, look at it first when checking an earnings report. It shows the real story of a company’s financial health.
Understanding the Flow: Operations, Investing, and Financing
Think of the cash flow statement as a play with three parts. It shows where a company’s money comes from and where it goes in operating activities, investing activities, and financing activities. This helps you understand what the company is focusing on and how it’s growing.
Operating Activities: This part shows the cash from the main business. It includes sales, money from customers, and daily expenses to keep the business running.
Investing Activities: This section shows how a company plans for the future. Are they buying new equipment, acquiring other businesses, or spending on research? This tells you a lot about their long-term plans.
Financing Activities: This last part shows how the company gets and uses money. Are they taking on new debt, buying back stock, or paying dividends? These actions say a lot about their financial strength and future outlook.
Real-World Examples: Sorting Truth from Myths
Through the years, I’ve noticed many businesses that seem very successful at first. But their cash flow shows a different story. They are actually losing money. I remember a software company that had great recurring income. Their income statement looked perfect. Yet, their cash flow showed ongoing losses. The issue was high upfront costs for customer acquisition. These costs were not fully shown in their earnings. The cash flow statement revealed they were losing money to maintain their image.
You can check the SEC website for company reports, including earnings. These reports are treasure troves of data. They help you see a company’s cash flow and understand its financial health.
Spotting Warning Signs: Tricks with Numbers
Watch out for tricks with numbers. Some companies use this to hide problems. They might delay payments to suppliers to make their cash flow look better. This creates a short-term boost but is not a lasting solution. As investors, we need to look beyond the surface and examine the details.
Free Cash Flow: The True Profit Measure
A key metric for me is free cash flow (FCF). This is the money a company makes after spending on things like new equipment. It’s what’s left for growth, dividends, or buying back stock. Free cash flow yield (FCF divided by market value) is a more trustworthy measure of value than the price-to-earnings (P/E) ratio. This is because it’s less easy to manipulate.
Watching for Changes: Cash Flow as a Key Sign
Think of cash flow as an early sign of change. When cash flow shifts, it often hints at how a company might perform soon. If operating cash flow keeps dropping, even if profits seem strong, it could be a warning sign. But if free cash flow suddenly rises, it might mean the company is growing fast. By noticing these trends, you can get ahead and predict market changes. Focusing on the cash flow statement helps you see a company’s true financial health. This way, you can spot problems early and make smarter investment decisions.
Decoding Management Commentary Like a Pro
The numbers in an earnings report show what happened in the past. But if you want to guess what might happen next, check out the management commentary. This is where company leaders share their thoughts and hints about the future.
Finding Clues: Beyond the Corporate Talk
After going through many earnings calls and management discussions, I’ve noticed some clues. Certain words and patterns can help predict the future. For example, when they say “challenging market conditions,” it might mean there are bigger problems they’re not ready to talk about. On the other hand, if they give clear details and specific goals, it usually means they’re confident.
Future Plans: Reading Between the Lines
Future plans, or how management sees upcoming performance, are key to understanding. There’s a catch, though: companies often say less than they might achieve. They prefer to beat expectations rather than fall short. So, even if their plans sound modest, they might expect to do better.
Also, listen to what they don’t say. Do they avoid certain topics or questions? Their silence can be as telling as their words. If a company is in a lawsuit, not talking about it during a call is a warning sign.
Words Matter: Understanding CEO Confidence
The way leaders talk can show big changes or problems ahead. Too much jargon can hide the truth. If their tone changes from optimistic to cautious, it might mean their outlook has changed. Compare a company’s performance with its past and its competitors. For instance, if the S&P 500 is expected to grow 12.9% this year, this helps you judge how a company is doing. It’s always smart to look at wider earnings trends.
Case Studies: Spotting the Real Deal
Analyzing management commentary from both winners and losers is a great way to sharpen your intuition. You start to recognize the difference between management teams that deliver and those who are masters of excuses. Look at a company like Google. Their CEO might provide clear, detailed commentary on their AI investments, demonstrating confidence in their long-term strategy. Compare that to a company like Moderna. Even while announcing positive vaccine developments, they might remain more cautious in their financial projections.
Identifying Catalysts: Using Tone and Word Choice
Management’s tone and word choice can often reveal potential catalysts for future stock price movement. A company might casually mention a new product or strategic partnership, seemingly downplaying its significance. But if the language surrounding that mention is unusually enthusiastic, it could indicate a major growth opportunity. Learning how to read earnings reports effectively takes time and practice.
The Uncomfortable Questions: What Makes CEOs Squirm
During earnings calls, listen carefully to the questions that make the CEO uncomfortable. These often highlight areas of uncertainty or potential risk. A hesitant response or an attempt to deflect a question could be a sign of underlying trouble.
The Bottom Line: Mastering Management Commentary
Mastering management commentary gives you a real edge. You’re no longer just understanding what happened; you’re anticipating what might happen next. This is how you go from a passive market observer to an active participant, making informed investment decisions based not just on numbers, but on the nuanced insights hidden within management’s words.
Your Complete Earnings Analysis System
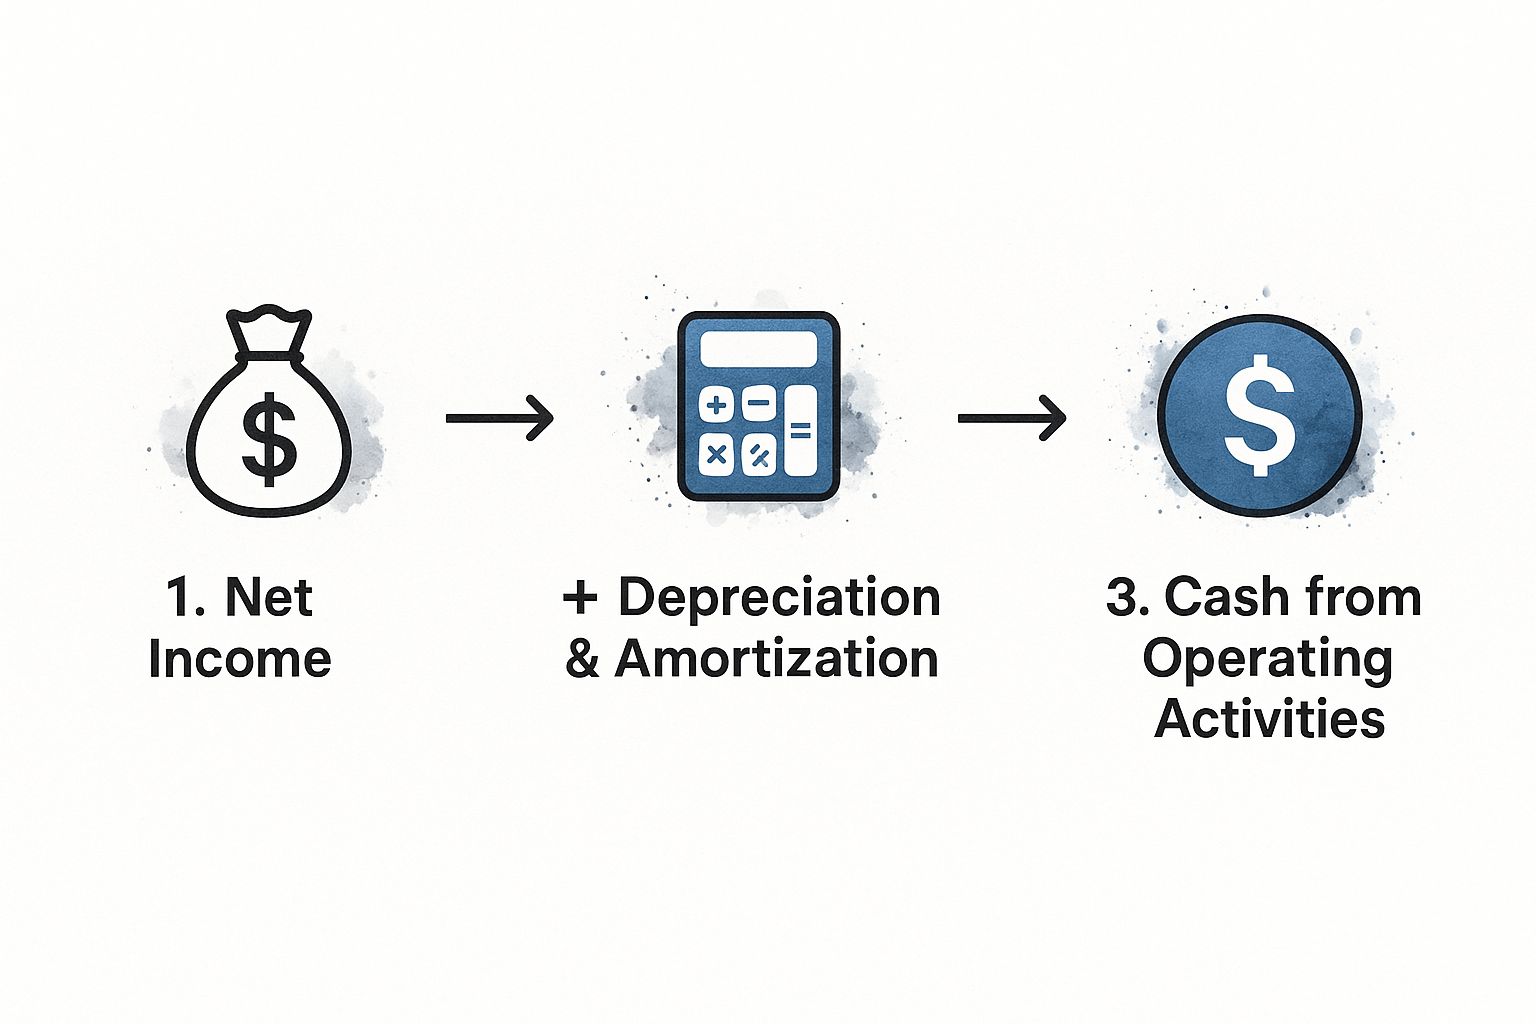
The infographic shows how money moves in a business. It starts with net income and adds back depreciation and amortization. This is important because these are not cash expenses. They reduce net income on paper, but no money leaves the company. So, by adding them back, we see the real cash flow.
Now, after reviewing each part of earnings reports, let’s put everything together. This is where the real understanding begins. We connect the dots and turn those numbers into smart investment choices.
Focusing Your Time: The 80/20 Rule for Earnings Analysis
The 80/20 rule helps a lot, especially during earnings season. You can find 80% of the important info in just 20% of the report. The key is knowing where to look. For me, it’s cash flow and management commentary. These often show the most about a company’s financial health and future.
Creating Your Workflow: A System to Follow
Having a system is important. I start by quickly scanning the income statement for trends. Then, I move to the cash flow statement and balance sheet. Lastly, I read the management’s discussion and analysis. This is often where the real story is. This routine keeps me efficient and focused.
Pattern Recognition: The Value of Experience
After going through many earnings reports, something surprising happens: you start to notice patterns. You see good and bad signs that often appear before big changes in stock prices. You learn how different numbers work together to show more about the company.
Sector-Specific Analysis: Changing Your Method
Don’t use the same approach for every company! Analyzing a fast-growing tech company is very different from looking at an older industrial business. Revenue growth is most important for tech companies, while steady profits and dividend payments matter more for established businesses.
Tracking Performance: Creating Your Own Record
Keeping a simple spreadsheet or database to track key numbers is a game-changer. You will notice trends and unusual things that you might miss in just one report. It also helps you learn from your successes and mistakes – crucial for long-term success.
Here’s a little cheat sheet I find useful for changing my analysis depending on the type of company:
To help you concentrate your efforts, here’s a useful table I use:
Key Earnings Analysis Checklist by Company Stage
|
Company Stage |
Priority Metrics |
Key Report Sections |
Red Flags to Watch |
|---|---|---|---|
|
Growth Companies |
Revenue growth, market share, customer acquisition cost |
Income Statement, Management Discussion & Analysis (MD&A) |
Cash burn rate, increasing debt |
|
Mature Businesses |
Profitability, dividends, return on equity |
Cash Flow Statement, Balance Sheet |
Declining revenue, shrinking margins |
|
Turnaround Situations |
Debt levels, restructuring charges, cash flow |
Balance Sheet, Cash Flow Statement, MD&A |
Lack of clear turnaround plan, continued losses |
This table breaks down which metrics and sections to prioritize depending on the type of company you’re analyzing. It’s a quick way to zero in on the most relevant information.
Common Mistakes: Avoiding Costly Errors
It’s easy to get distracted by short-term news. Don’t panic about small changes in earnings! Focus on steady growth. And always pay attention to cash flow. A company might seem successful on paper but could be losing money quickly.
Time-Saving Techniques: Managing Earnings Season
Earnings season can be overwhelming. Use a calendar to track upcoming reports. Focus on the companies you care about most. You don’t need to examine everything!
Objectivity: Keeping Emotions in Check
We all have favorite companies. But investing with emotions is risky. Keep your feelings in check and base decisions on facts. Remember, investing is about chances, not guarantees. Stay organized, understand the details, and watch for patterns. This will help you find useful insights and gain a real edge.
Building Your Earnings Analysis Expertise
Reading financial reports can feel like learning a new language. It’s tough at first, but practice helps. This section will guide you. We’ll cover free online resources and some advanced techniques. The goal is to help you improve over time.
Realistic Expectations and Building a Plan
Let’s be real; no one becomes an expert on earnings reports overnight. It’s like a marathon. Start with small goals. Maybe look at one report each week in an industry you find interesting. As you get better, slowly increase the number of reports. Think of it like exercising; consistency builds strength.
Free Resources and Analytical Tools
One of the best things about learning this skill is the many free resources. The SEC website (sec.gov) is a great place for company filings and earnings reports. Sites like Yahoo Finance and Google Finance offer free tools and data. Later, you might try premium tools like the Bloomberg Terminal or FactSet. But you can learn a lot from free resources.
Keeping Up: Accounting Changes and Reporting Rules
Accounting rules are not always the same. They can change. It’s important to stay updated. The FASB website is a good place to check for updates. Reading industry blogs and financial news can also help you stay informed. Knowing how accounting changes will keep your work precise and on point.
Choosing Practice Cases: Learn from Real Examples
Picking the right companies to study is important. Start with well-known companies in different areas. For example, you could look at Apple. They have clear financial reports. Then, try looking at companies like Tesla. Tesla might be more challenging because it grows fast and has different business parts. The key is to look at a mix of companies. This will help you understand more and get ready for different situations.
Checking Your Progress: Measure How You’re Doing
Want to know if you’re getting better? Test yourself! After you study a report, try to guess the company’s future results, like next quarter’s earnings. When the real results come out, see how close your guess was. This helps you see where you need to improve. It’s like having a coach for your financial skills.
Connecting with Others: Learn Through Discussion
Talking with other investors can really boost your learning. Join online groups or clubs to chat about your findings. Hearing others’ views can show you things you missed. Even experts share ideas with others, so don’t overlook the power of learning together.
Breaking Through Challenges
Sometimes it feels like you’re stuck. Don’t worry; it’s normal. When this happens, go back to old materials, try new ways to analyze, or ask for advice from others. Often, trying different things helps you move forward.
Going Deeper: Advanced Analysis
Once you know the basics, try learning more advanced methods. This could be valuation modeling, cash flow analysis, or looking at options activity. These can help you understand a company’s finances in more detail.
Making Earnings Analysis a Habit
The goal is to make earnings analysis a regular part of your routine. Don’t just read reports. Use them to test your ideas, find new chances, and avoid mistakes. Earnings reports can be very useful tools when you use them actively.