
The road to financial freedom isn’t about luck or quick tips. It’s built on knowledge, discipline, and planning. Famous investors like Warren Buffett and Peter Lynch didn’t succeed by chance. They understood the real value of what they invested in. This is what sets serious investors apart from those who only guess in the market.
Investment analysis turns confusing market noise into clear, helpful signals. It helps you make decisions with confidence. In this guide, we will go beyond news and social media buzz. We will explore key methods that experts use to find opportunities and manage risks. Whether you’re an experienced trader or new to investing, learning these methods will greatly improve your strategy.
We will explain tricky ideas like Discounted Cash Flow (DCF) and Monte Carlo simulations focused on risk. Plus, we’ll give you real examples and show you how to use these tools to create a strong and profitable portfolio. You don’t have to be a Wall Street insider to do this. Now is a great time to learn and start building your own success story. Let’s begin.
1. Discounted Cash Flow (DCF) Analysis
Imagine being able to look into a company’s future and figure out its true value today. This is not a fantasy; it is the power of Discounted Cash Flow (DCF) analysis. At its core, DCF is a way to value a company based on a simple truth: a dollar today is worth more than a dollar next year. It does this by predicting all the money a company will make in the future and then adjusting that amount to today’s value.
This approach makes you look past short-term market changes and focus on what really drives a business over time. It is one of the most trusted methods for analyzing investments because it focuses on true worth. Famous investor Warren Buffett used this method to buy See’s Candies in 1972, spotting its ability to make money before others did. Private equity firms also use DCF a lot to figure out the value of potential buyouts, seeing future potential that others might not.
To do a DCF analysis, you need to handle three key parts: predicting future cash, choosing the right discount rate, and finding a final value. The infographic below gives a quick guide to these important elements.
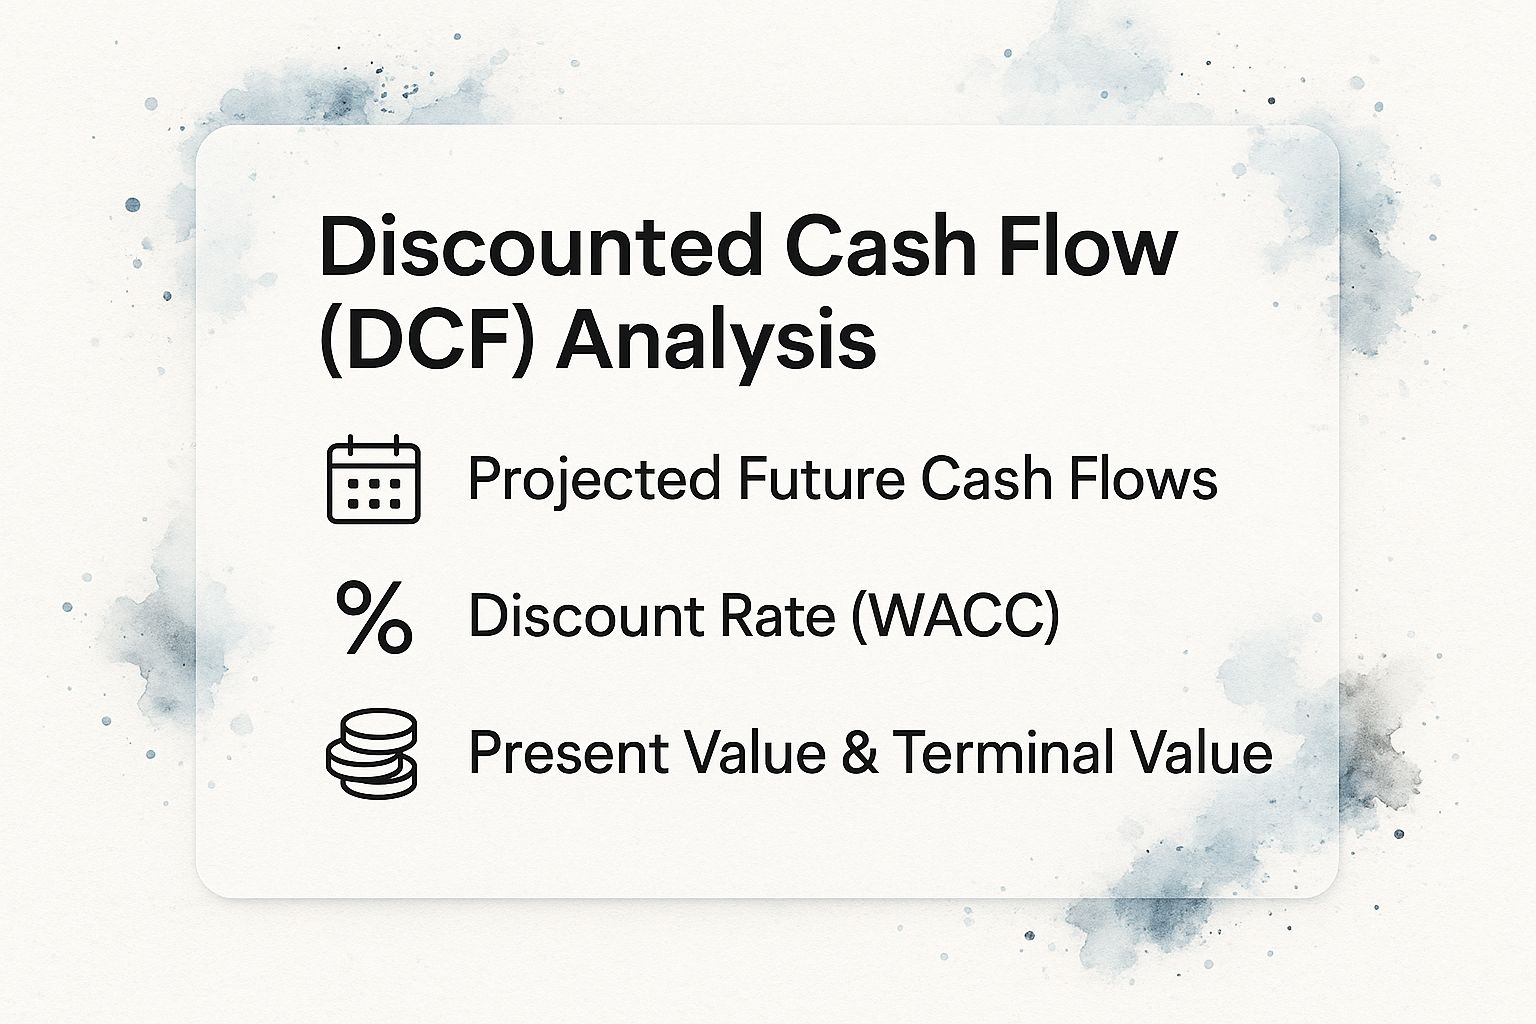
Discovering Value with DCF: Simple Tips
This summary explains the DCF process, showing how your views on future growth and risk shape the final value.
Focus on Free Cash Flow (FCF): Look at FCF instead of accounting earnings. FCF is the real money that can be given to investors, stockholders, and debtholders. It paints a clearer picture of financial health.
Consider Different Scenarios: Don’t just stick with one result. Create a base-case, an optimistic-case, and a pessimistic-case model. This helps check your assumptions and prepares you for different future outcomes. It gives a range of values, not just one number.
Do Sensitivity Analyses: Change your main assumptions, like growth and discount rates, to see how they affect the final value. This shows which factors matter most for your investment ideas.
2. Fundamental Analysis
Imagine looking at a stock not just by its price, but by the strength and future of the company behind it. This is what fundamental analysis does. It helps you find a stock’s true worth by checking its financial and economic facts. First, you become a business analyst, then an investor. You ask key questions: Is the company making money? Is it well-managed? Does it have an edge over rivals?
This deep study is the base of value investing. It is one of the longest-standing ways to analyze investments. Benjamin Graham started it, and Warren Buffett, his student, used it to build huge success. Peter Lynch also used it to spot hits like Dunkin’ Donuts by watching trends and then checking the company’s numbers. During the 2008 crisis, sharp investors found undervalued banks by looking at strong balance sheets while others worried.
When you do fundamental analysis, you look at a company in three ways: its economic surroundings, its place in the industry, and its own features like finances and management. By putting these pieces together, you see the true value of the business, apart from its market price.
Practical Tips for Fundamental Analysis
Though the idea is simple, doing it well takes effort and a plan. To turn raw data into useful knowledge, try these tips:
Start Broad: Before looking at a single stock, learn about its industry. Is it growing or shrinking? A good company in a bad industry has challenges, so always check the bigger economic picture first.
Find the “Moat”: A moat is what keeps a company ahead of others. It could be a strong brand or a cost edge that others can’t copy.
Compare Numbers: A P/E ratio or profit margin means little alone. Always compare a company’s key numbers to its rivals and past performance. This shows if it stands out or is just average.
Focus on Leaders: Good leaders can make a company great, while bad ones can ruin it. Check the leaders’ track records, honesty, and how they handle money. Read their letters to investors to see their vision and openness.
3. Technical Analysis
What if you could understand the market’s emotions—like fear, greed, and uncertainty—just by looking at a chart? This is what Technical Analysis is all about. It’s a way to predict future prices by examining past data, mainly price and volume. The main idea is that everything important, like earnings or trends, is already shown in the price. People’s actions create patterns that repeat over time.
This technique skips looking at a company’s financial documents. Instead, it focuses on supply and demand seen on a chart. It is a very active method for analyzing investments because it gives clear signals for when to buy, sell, or manage risk. Famous trader Paul Tudor Jones used it to foresee the 1987 market crash. Today, funds like Renaissance Technologies use complex algorithms based on past price patterns. Even simple day traders use basic ideas from this method.
Technical analysis relies on three main things: finding the main trend, spotting repeating patterns like “head and shoulders” or “triangles,” and using math tools to check momentum and market conditions. The chart below shows how these parts help make trading choices.

This picture shows how technical analysis turns market data into clear signals for traders.
Reading the Tape: Simple Tips
A chart can lead to profits or confusion. To use technical analysis well, stick to a plan and keep learning.
Use More Than One Indicator: Don’t rely on just one indicator. Boost your chances of a good trade by using different indicators together. For example, mix a tool like Moving Averages with a momentum tool like the Relative Strength Index (RSI).
Learn Risk Management: The market can go against you. Always set your exit point before trading by using a stop-loss order. This helps protect your money from big losses and keeps emotions out of your decisions.
Try Paper Trading: Before risking real money, test your ideas with a paper trading account. This lets you improve your plan, understand market changes, and gain confidence without losing cash.
Trade in Busy Markets: Technical analysis works best in markets with lots of trading, like big stock groups, large companies, and main currency pairs. High trading volume makes price patterns more trustworthy and less affected by big single traders.
4. Comparative Analysis (Relative Valuation)
Imagine trying to find the best player in a league without looking at the stats of their teammates or opponents. You can’t do it. Comparative analysis, or relative valuation, uses this same idea in the stock market. It works on a simple rule: a company should be valued like others that are in the same industry, have similar size, and growth outlook.
This method keeps your valuation grounded in today’s market. Instead of guessing the future, you check what investors are ready to pay for similar companies now. Investment bankers use this to price IPOs, while private equity firms compare companies to decide on potential buyouts. As one of the most useful investment analysis methods, it quickly shows if a stock is priced higher or lower than its competitors.
Finding Value with Comparables: Easy Tips
Relative valuation is only as good as the comparisons you make. To make sure your analysis is helpful, follow these key tips:
Pick the Right Peer Group: Don’t just look at industry labels. To find real peers, check their business models, who their customers are, and where they operate. A software company for small businesses isn’t the same as one for big companies, even in the same sector.
Adjust for Differences: No two companies are exactly alike. You need to adjust for big differences in growth, profit margins, and capital setup. If one company is growing faster than others, it deserves a higher value. Ignoring this will give wrong results.
Use Different Metrics: Relying on just one number, like the Price-to-Earnings (P/E) ratio, can mislead you. Use different metrics, like Price-to-Sales (P/S), Enterprise Value-to-EBITDA (EV/EBITDA), or Price-to-Funds From Operations (P/FFO) for REITs, to get a full and reliable valuation.
5. Net Present Value (NPV) Analysis
Imagine you are at a fork in the road. Each path is a big investment choice. How do you pick the one that brings real value? Net Present Value (NPV) analysis is a clear guide. It shows the gap between the future money a project will make and the money it will cost, including the start-up cost. A positive NPV means the project should make more money than it costs, which is a good sign to invest.
This method is a key part of business finance. It is popular in textbooks and used by big firms like McKinsey & Company because it connects directly to shareholder value. It is one of the most important ways to study investments for planning. For example, a tech company may use NPV to decide if long-term R&D will be worth it. Real estate developers use it to see if a new building will be profitable in the long run. Manufacturing companies use it to see if buying new equipment will save money in the future.
Finding Value with NPV: Simple Tips
The NPV formula is easy, but its strength is in the details. To make sure your analysis is helpful, follow these tips:
Adjust Your Discount Rate for Risk: Do not use the same rate for everything. The rate should match the risk of the project. A risky new market venture needs a higher rate than a safe equipment upgrade.
Consider Every Dollar: Look beyond the basic price. Include all cash flows, like future working costs, maintenance, and end value. Think about opportunity costs too—the value of the next best choice you miss.
Test Your Assumptions: One positive NPV number can fool you. Change key assumptions, like sales growth, to see how NPV changes. This helps you understand which factors are the most risky.
Use Tax Benefits: Don’t forget taxes. Depreciation is not a cash cost, but it lowers your taxable income. This creates a “tax shield” that reduces tax payments. Adding these tax shields to your cash flow will give a more accurate NPV.
6. Internal Rate of Return (IRR) Analysis
What if you could sum up the whole journey of an investment into one simple number? That’s what the Internal Rate of Return (IRR) does. IRR shows the discount rate where the value of future cash flows equals the starting investment, making the net present value (NPV) zero. It’s like finding the investment’s yearly growth rate.
This single number helps compare investments quickly. It’s a key tool for decision-makers. Many use it because it’s simple. For example, private equity funds share their success using IRR. It turns complex results into a clear measure of success. Real estate developers use IRR to see which property projects offer the best returns. Venture capital firms use it to pick startups with high potential returns.
Although one number is appealing, understanding its context is crucial. IRR assumes all cash flows are reinvested at the same rate, which isn’t always true in real life. Knowing this helps use IRR wisely.
Using IRR Wisely: Helpful Tips
To use IRR well, and avoid mistakes, follow these tips:
Use with Net Present Value (NPV): Don’t rely only on IRR. IRR shows return rate, while NPV shows the actual value in dollars. A project with a 30% IRR might be less valuable than one with 20% if the second one is much bigger. Use both together for a clear view.
Watch for Odd Cash Flows: Be careful with projects that have unusual cash flows, like a big loss in the middle. These can give multiple IRRs or none at all, making it unreliable.
Try Modified IRR (MIRR): For a realistic view, use MIRR. It lets you choose a different reinvestment rate, like the company’s cost of capital, which is more practical.
Set a Minimum Rate: Don’t just calculate IRR; compare it to a benchmark. Set a minimum return rate, or “hurdle rate,” based on your costs and risks. Only take an investment if its IRR is much higher than this rate.
7. Monte Carlo Simulation
Imagine you could explore many future scenarios for your investments. This isn’t about guessing. It’s about using strong computer calculations. This is what Monte Carlo simulation does. It faces uncertainty and shows many possible results. Instead of a single, fixed guess, it runs lots of tests with random numbers. This helps map out the chances of different outcomes. It paints a clearer picture of the risks and benefits you might face.

This method goes beyond basic predictions. It models the complex links in financial markets. It’s essential for modern risk management. Big names like JPMorgan use it in their RiskMetrics system. Investment banks use it to figure out Value at Risk (VaR). Pension funds also depend on it to plan for future retirements. While thinkers like Nassim Nicholas Taleb point out its limits, especially for unexpected events, it’s still one of the best methods for understanding likely outcomes. It started with pricing complex derivatives on Wall Street.
Facing Uncertainty with Monte Carlo: Useful Tips
A Monte Carlo model’s results show how it’s built. To get the most out of it, follow these steps:
Choose Distributions Wisely: The key is the probability distribution you pick for each input, like interest rates or returns. Check if a normal, log-normal, or another type fits past data best for a realistic model.
Run Many Simulations: Use enough computer power. Run at least 10,000 simulations. This helps get stable and reliable results.
Check Against Real Data: Compare your model with past data. If past results don’t match, the future assumptions might need changes.
Focus on Risk: The aim is not a single “right” answer but to see possible outcomes. Use results to answer key questions: “What are the chances of losing more than 20%?” or “What are the most likely return ranges?”
8. Economic Value Added (EVA) Analysis
Imagine a financial measure so strong it makes a company ask one key question: Are we truly building wealth, or just going in circles? This is the clear view given by Economic Value Added (EVA) analysis. EVA shows a company’s real economic profit by checking the value made beyond the cost of the capital used. It looks past regular profits to see if a business is truly rewarding its investors.
This focus on using capital well is why EVA became a key part of strategy for big companies like Coca-Cola and AT&T in the 1990s. The consulting firm Stern Stewart & Co. started it, and General Electric’s Jack Welch used it to create a culture of ownership. He made sure every manager focused on returns that beat their cost of capital. For this reason, EVA is one of the best tools for judging how well a company runs.
The calculation mirrors this idea simply. You start with a company’s Net Operating Profit After Taxes (NOPAT) and subtract a “capital charge.” This charge is the total invested capital times its average cost. If the result is positive, value grows. If it’s negative, shareholder value shrinks, no matter what the income statement shows.
Unlocking Value with EVA: Simple Tips
While the formula is easy, getting true insight from EVA needs careful thought. To understand a company’s performance well, try these tips:
Focus on Key Adjustments: Regular accounting can hide the real picture. To see true NOPAT and invested capital, find the most important adjustments for the industry, like counting research expenses or adjusting for leases.
Prioritize Comparisons: One EVA number alone isn’t very useful since big companies will have bigger EVA figures. The real strength is in tracking a company’s EVA over time or comparing it with competitors in the same field to see who works most efficiently.
Combine with Traditional Metrics: EVA is a strong tool, but don’t use it alone. Always look at it with other measures like free cash flow, return on invested capital (ROIC), and earnings growth to form a complete view.
Consider EVA-Based Incentives: When checking a company, see if it uses EVA-based incentives for its managers. Companies that link pay to EVA often show better capital use and a stronger focus on long-term value.
Investment Analysis Methods Comparison
|
Method |
🔄 Implementation Complexity |
🛠️ Resource Requirements |
⭐ Expected Outcomes |
💡 Ideal Use Cases |
⚡ Key Advantages |
|---|---|---|---|---|---|
|
Discounted Cash Flow (DCF) |
Medium to high; requires detailed cash flow projections and discount rate inputs |
Moderate; financial modeling skills and data needed |
Provides intrinsic value estimates independent of market sentiment 📊 |
Long-term investment in mature companies with predictable cash flows |
Based on fundamentals, flexible and widely accepted ⭐ |
|
Fundamental Analysis |
High; involves deep research on financials, industry, and macro factors |
High; requires extensive data gathering and expertise |
Identifies undervalued assets with deep business insights ⭐ |
Long-term investing, value discovery, understanding business quality |
Comprehensive view of business health and competitive advantages 💡 |
|
Technical Analysis |
Low to medium; pattern recognition and indicator application |
Low to moderate; charting tools required |
Offers timing signals for entry/exit with price trend predictions ⚡ |
Short-term trading, timing decisions across asset classes |
Specific trade signals, works in various markets and timeframes ⚡ |
|
Comparative Analysis (Relative Valuation) |
Low; uses standard multiples and peer comparisons |
Low; relies on market and peer data |
Quick relative valuation aligning with market sentiment 📊 |
Initial screening, relative ranking within industries |
Fast, easy to understand, reflects current market sentiment ⚡ |
|
Net Present Value (NPV) |
Medium; requires detailed cash flow estimation and discounting models |
Moderate; needs financial projection and discount rate inputs |
Provides absolute dollar value of investment benefit 🎯 |
Capital budgeting, project evaluation across industries |
Clear accept/reject criteria, accounts for timing of cash flows ⭐ |
|
Internal Rate of Return (IRR) |
Medium; solving for rate with multiple cash flows can be complex |
Moderate; requires cash flow data and computational tools |
Percentage return for ranking and comparing investments 📊 |
Ranking investments and private equity performance reporting |
Easy to communicate, independent of external discount rate 💡 |
|
Monte Carlo Simulation |
High; sophisticated statistical modeling and scenario generation |
High; software tools and statistical expertise necessary |
Probability distributions of outcomes with risk assessment ⭐ |
Portfolio risk management, pricing derivatives, stress testing |
Captures uncertainty and variable interactions comprehensively ⚡ |
|
Economic Value Added (EVA) |
High; complex accounting adjustments and cost of capital calculations |
High; detailed financial and accounting data required |
Measures true economic profit above cost of capital 📊 |
Performance measurement, incentive compensation, capital allocation |
Focuses on economic value creation and capital efficiency ⭐ |
From Analysis to Action: Your Path to Investment Mastery
We have explored eight investment analysis methods. These range from Fundamental Analysis to Monte Carlo simulation. This was not just about financial formulas. It was about seeing the market in a new way. Each method offers a different view of an investment’s potential. The key insight is that no single method gives the full picture.
The real skill in investing is not about finding one “best” method. It is about combining different methods. Successful investors do not stick to one technique. Instead, they mix insights from various methods. They create a detailed investment plan called a “mosaic.”
The Mosaic Thesis: Building Your Investment Picture
Imagine trying to understand a business by only looking at its income statement. You would miss what the balance sheet and cash flow statement reveal. Similarly, using only a Discounted Cash Flow (DCF) model might cause you to overlook market trends that Technical Analysis highlights. A numbers-only approach ignores a company’s leadership or brand strength.
Your aim is to become skilled at creating this mosaic for each investment. Use Fundamental Analysis to see if a company is solid. Then, use Comparative and DCF analysis to check if the stock price is fair. Finally, use Technical Analysis to decide the best time to act. This combination turns separate data into a strong investment story, giving you confidence based on thorough research.
Your First Step: Picking Your Starting Point
Building your tools can seem tough, but start with one step. Choose the investment analysis methods that match your goals and time.
Consider these paths:
Long-Term Value Seeker: Start with Fundamental Analysis and DCF Analysis. Focus on understanding the business well. Your goal is to find a company’s true value and buy it for less, waiting for the market to notice.
Market Trend Follower: Dive into Technical Analysis and Comparative Analysis. You look at charts and patterns. You care less about long-term forecasts and more about current trends.
Careful Capital Manager: Begin with Net Present Value (NPV), Internal Rate of Return (IRR), and Risk-Adjusted Return. You think like a financial officer, assessing investment choices. Your main question is, “Will this give a good return for the risk involved?”
From Theory to Practice: Using What You Learn
These ideas only work when you apply them. Do not let them stay as theories. Start by analyzing a company you know well, like one whose products you use. Compare it to a close competitor. Make a simple DCF model. You will see how this helps.
Focus on improving, not being perfect right away. Your first analyses may not be perfect, and that is okay. The goal is not to predict the future exactly but to develop a reliable process that gets better over time. Each analysis, whether it leads to profit or a lesson, adds to your experience. This helps you turn market noise into clear signals and guesswork into solid strategy.
To speed up your learning and see how these methods fit together, try a platform like Stock Decisions. It brings these investment analysis methods together in a clear way, helping you build your investment picture faster. See how you can boost your investment skills today at Stock Decisions.
- Inflation and Stock Market: Your Complete Survival Guide
- How to Rebalance Portfolio Like a Pro: Real-World Strategies
- 8 Financial Modeling Best Practices to Master in 2025
- Get Your Example Risk Assessment Report – Professional & Editable Templates
- 8 Powerful Investment Analysis Methods to Master in 2025