
Why Risk Assessment Reports Matter More Than You Think

Many businesses see risk assessment reports as just another task for compliance, often ignored after completion. This misses the true value. A good report isn’t just about the past; it’s a tool for the future. Imagine it like a weather radar that detects storms in advance. This forward planning is what helps companies succeed rather than always dealing with problems.
Smart companies use risk assessment to tell a story. Instead of listing problems, their reports explain how and why risks could impact the business. By moving from just fixing issues to smart risk planning, they gain a big advantage. They understand that an excellent risk report isn’t just about avoiding problems; it’s about finding chances in challenges.
From Ideas to Action
A risk report shows its value when it turns vague threats into clear actions. It connects knowing about a risk with knowing what to do. For example, just noting “supply chain disruption” isn’t enough. A strong report goes deeper, identifying which suppliers or parts are at risk and creating a plan to handle it.
This means changing how we think:
From Compliance to Planning: The report guides smart decisions, not just satisfies rules.
From Separate to Connected: Understanding that risks are linked. A money issue might come from an operational problem or an event far away.
From Fear to Planning: Using risk study to make smart decisions, knowing all risks are considered.
In the end, a report’s success is measured by how it inspires action. It should help leaders make smart choices and protect the business’s future.
The Huge Cost of Ignoring Risk
Ignoring risk checks can cause big money problems. Today, risks are bigger than ever because we are all connected. Think about this: disasters cost the world over $2.3 trillion each year. This includes all the effects on people and nature. Just dealing with problems after they happen is not a good plan anymore.
For more details, look at the 2025 Global Report from the UNDRR. This shows why it’s important to check risks early. By looking at all effects, not just the first ones, companies can make sure they stay safe and grow.
Understanding Report Parts That Work

A strong risk assessment report is more than just numbers; it’s a story that helps make smart choices. The key difference between a report that gets ignored and one that leads to action is how it’s put together. Every good risk assessment report follows a clear plan, making sure nothing important is left out and every point is easy to understand.
Think of it like building a house. You need a firm base, a solid frame, and a good layout to make it useful. Similarly, your report needs clear, well-ordered parts that fit together to show the full picture of risks. This isn’t about sticking to strict rules—it’s about making everything easy to follow and understand.
The Parts of a Useful Report
To see how these parts work, let’s break it down. Each part has a role in telling the whole risk story, ensuring the information is clear and engaging. If one part is weak, it can hurt the whole report.
Executive Summary: This is your quick pitch. It’s not just an intro; it’s a short version of the whole report for busy leaders. It highlights the biggest risks, possible effects on the business, and the main advice. It needs to show urgency and importance to get leaders to read more and support the ideas.
Risk Identification and Description: This section goes beyond vague terms like “cyber risk.” Describe each threat clearly. Explain the event, why it might happen, and which parts of the business it might hit. Instead of saying “market downturn,” be specific: “A possible 20% drop in consumer spending due to rising interest rates, affecting Q4 sales for our premium products.” This clarity is key for the next steps.
Risk Analysis and Evaluation: Here, you measure the risks you’ve found. This often involves two key points:
Probability/Likelihood: How likely is the risk? This can be shown as a percentage, a frequency, or a simple high-medium-low scale.Impact/Severity: If the risk happens, how bad will it be? This is often measured in money but can also include harm to reputation, downtime, or legal issues.
Combining these points helps you decide what to focus on. A low-risk, low-impact threat needs less attention than a high-risk, high-impact one. Many groups use a risk grid to plot these risks, making it easy to see which ones need focus. Research shows that regular checks can lead to fewer problems over time, proving the value of ongoing analysis.
Mitigation and Control Strategies: This is the “what we’ll do about it” section, and it’s very important. For each big risk, propose a specific plan. These plans usually fall into four groups:
Avoid: Change plans to remove the risk.Reduce: Put controls in place to lower the chance or effect.Transfer: Shift the financial impact, often through insurance.Accept: Recognize the risk and move on, usually for low-impact threats.
This section should say who is responsible, set deadlines, and define what success looks like. This turns the report from a warning into a clear action plan.
To help you visualize how these parts come together, the table below breaks down each component’s role, content, and general size.
|
Section |
Purpose |
Key Content |
Typical Length |
|---|---|---|---|
|
Executive Summary |
To provide a high-level overview for leadership, highlighting key findings and recommendations. |
Most critical risks, summary of potential impacts, and main action items. |
1-2 paragraphs |
|
Risk Identification and Description |
To clearly define and describe each potential risk in detail. |
Specific event details, potential causes, and affected business areas. |
1-2 paragraphs per risk |
|
Risk Analysis and Evaluation |
To quantify and prioritize risks based on their likelihood and potential damage. |
Probability/likelihood scores, impact/severity ratings, and often a visual risk matrix. |
2-3 pages |
|
Mitigation and Control Strategies |
To outline a clear, actionable plan for managing identified risks. |
Proposed actions (avoid, reduce, transfer, accept), owner assignments, and timelines. |
1-2 pages |
This table shows how each section has a distinct job, from the quick summary for executives to the detailed action plans for management teams, ensuring the report is useful for every stakeholder.
Modern Risk Assessment Methods That Get Results

The days of using only gut feelings and simple charts are over. Today, the best risk evaluations mix old principles with new, data-rich methods. The goal is to move from just fixing problems to making smart decisions ahead of time. This means combining the “what” and “why” from insights with hard numbers to get a full picture of risk.
Choosing the right method is important. For simple issues, a basic method might work. But with tricky problems like finance or cybersecurity, newer methods give a clearer view. The key is to match the tool to the task, thinking about your resources, the risk complexity, and how much risk you can handle. This way, your risk report becomes a useful tool, not just a paper to store away.
Mixing Qualitative and Quantitative Methods
The best risk assessments use both qualitative and quantitative methods together. It’s like a doctor diagnosing a patient. The doctor listens to the patient’s symptoms (the story) and also looks at test results (the data). Both are needed for a correct diagnosis and treatment plan.
Qualitative Assessment: This looks at the nature of a risk. It uses expert opinions and interviews to describe threats. It explains the “how” and “why,” adding context that numbers can’t. For example, it would explore the reputational damage from a data breach.
Quantitative Assessment: This puts numbers on risk, like cost and likelihood. It uses past data and analysis to find metrics like Annual Loss Expectancy (ALE). This is good for measurable risks, like the cost of a factory shutdown for a day.
By combining these, an organization gets a better understanding. Qualitative tells the risk’s story, while quantitative adds numbers. This makes it easier to decide what to focus on first.
The Growth of Data-Driven Systems
Today, managing risks relies a lot on data and predictions. Instead of only focusing on past events, these systems look ahead. For example, an investment company might study market changes to guess how a portfolio might do in different economic situations. This way, a risk report becomes a guide for the future, not just a record of the past.
This data-based method is great for looking at big, wide-ranging risks. Many companies now use indexes that look at many factors on a large scale. One example is the Q1 2025 GlobalData Country Risk Index. It checks countries using economic, political, and environmental data. Recently, it showed a small rise in the global risk score to 55.8, with 54 countries now seen as high-risk. Countries like Denmark and Switzerland, however, stay steady.
This organized data analysis helps companies all over the world foresee problems and change their plans as needed. You can find more about these global risk insights in the Global Risk Report from GlobalData. This shows how a well-made risk assessment can use outside data to shape inside plans, offering a clear view of the world.
Full Example Risk Assessment Report Template
Understanding theory and best practices is good, but seeing them in action is better. To link ideas to real outcomes, this part offers a detailed example risk assessment report template. It’s a practical tool you can use for your needs, like checking investment portfolios, operations, or new business ideas.
We will go through each part of this template step-by-step, explaining why each part is important. You’ll see how the summary quickly shares key information, how risk descriptions give needed context, and how plans make a clear way forward. This example covers various risks—from market changes to supply chain problems—to show how to create a clear story from different threats. It’s not just a blank form; it’s a guide to good risk communication that is both a learning tool and a starting point.
A key idea in risk management is using known, worldwide systems. The picture below, from the International Organization for Standardization’s page on ISO 31000, shows the international standard for risk management.
This image shows the main ideas, framework, and steps that build a strong risk management system. It points out how leadership and commitment are key for success. Our template follows these same ideas of integration, structured action, and ongoing improvement.
1.Executive Summary
This is a quick overview for busy leaders. It answers key questions right away: What is happening? What is important? What actions should we take?
Report Title: Q3 2025 Risk Assessment Report for [Your Company/Portfolio]
Date of Report: October 15, 2025
Prepared By: [Your Name/Department]
Overall Risk Level: Medium-High
Key Findings: We found three big risks that need quick action: (1) market changes due to rising interest rates, (2) supply chain problems in Southeast Asia, nd (3) new rules on data privacy. Ignoring these could cut Q4 revenue by 5-8%.
Core Recommendations: We suggest finding more suppliers right away, using financial strategies to handle currency changes, and checking data practices to follow new rules.
2. Scope and Methodology
This section explains what was included in the report and how we did the research. It helps build trust in our findings.
Assessment Scope: We looked at financial, operational, and compliance risks for [Your Company/Portfolio] from October 1, 2025, to December 31, 2025. We included main assets, key processes, and important partners.
Methodology: We used both numbers and expert opinions. We looked at financial data and talked to experts. We used a 5×5 chart to score risks by how likely they are and how big their impact could be.
3. Risk Identification and Analysis
Here’s where the raw data comes to life. This table breaks down each specific risk, assigning it a category and a score to help prioritize what to focus on first.
|
Risk ID |
Risk Description |
Category |
Likelihood (1-5) |
Impact (1-5) |
Risk Score (L x I) |
|---|---|---|---|---|---|
|
FIN-01 |
A 10% decline in key international markets due to prolonged high-interest rates, which would hurt export sales. |
Financial |
4 (Likely) |
4 (Major) |
16 (High) |
|
OP-01 |
A shutdown of our main component supplier in Vietnam because of local labor strikes, leading to production delays of up to 4 weeks. |
Operational |
3 (Possible) |
5 (Critical) |
15 (High) |
|
COM-01 |
Not complying with new GDPR-like data privacy laws, which could lead to fines of up to 2% of our yearly revenue. |
Compliance |
2 (Unlikely) |
5 (Critical) |
10 (Medium) |
|
STR-01 |
A major competitor launches a game-changing product, potentially taking 5% of our market share within six months. |
Strategic |
3 (Possible) |
3 (Moderate) |
9 (Medium) |
4. Mitigation and Response Plan
This part of the risk assessment report is very important. It turns analysis into a real plan with steps to follow. It gives tasks to specific people and sets deadlines, so things get done.
For Risk FIN-01 (Market Downturn):
Action: Use strategies to protect against currency changes.
Owner: CFO / Finance Team
Timeline: By November 1, 2025
Success Metric: Reduce possible currency losses by 50%.
For Risk OP-01 (Supply Chain Disruption):
Action: Find another supplier in a different place, like Mexico.
Owner: Head of Operations
Timeline: By December 15, 2025
Success Metric: Ensure no more than 20% of our supplies are from one area.
For Risk COM-01 (Compliance Failure):
Action: Check all data processes and train everyone who deals with customers.
Owner: Chief Compliance Officer
Timeline: By January 31, 2026
Success Metric: Achieve 100% compliance with new rules, confirmed by an external auditor.
Understanding Risk Connections
When you look at risks one by one, they might seem easy to handle. But today’s risk environment is not so simple. It’s like a tangled web. One event can trigger a series of problems throughout a business in unexpected ways. For example, a conflict in another country might block a key shipping route. This is an operational risk. Due to this, your material costs might increase, which is a financial risk. This can then delay your product launch, a strategic risk. Seeing how these risks connect makes an insightful risk assessment report important.
Knowing these links is crucial because they can make risks worse. A small problem can quickly turn into a big crisis if you don’t prepare for its side effects. This is why smart organizations look beyond simple risk lists. They ask, “What might go wrong?” and also, “If this happens, what else could be affected?”
This chart shows what a portfolio’s risks might look like after a first review.
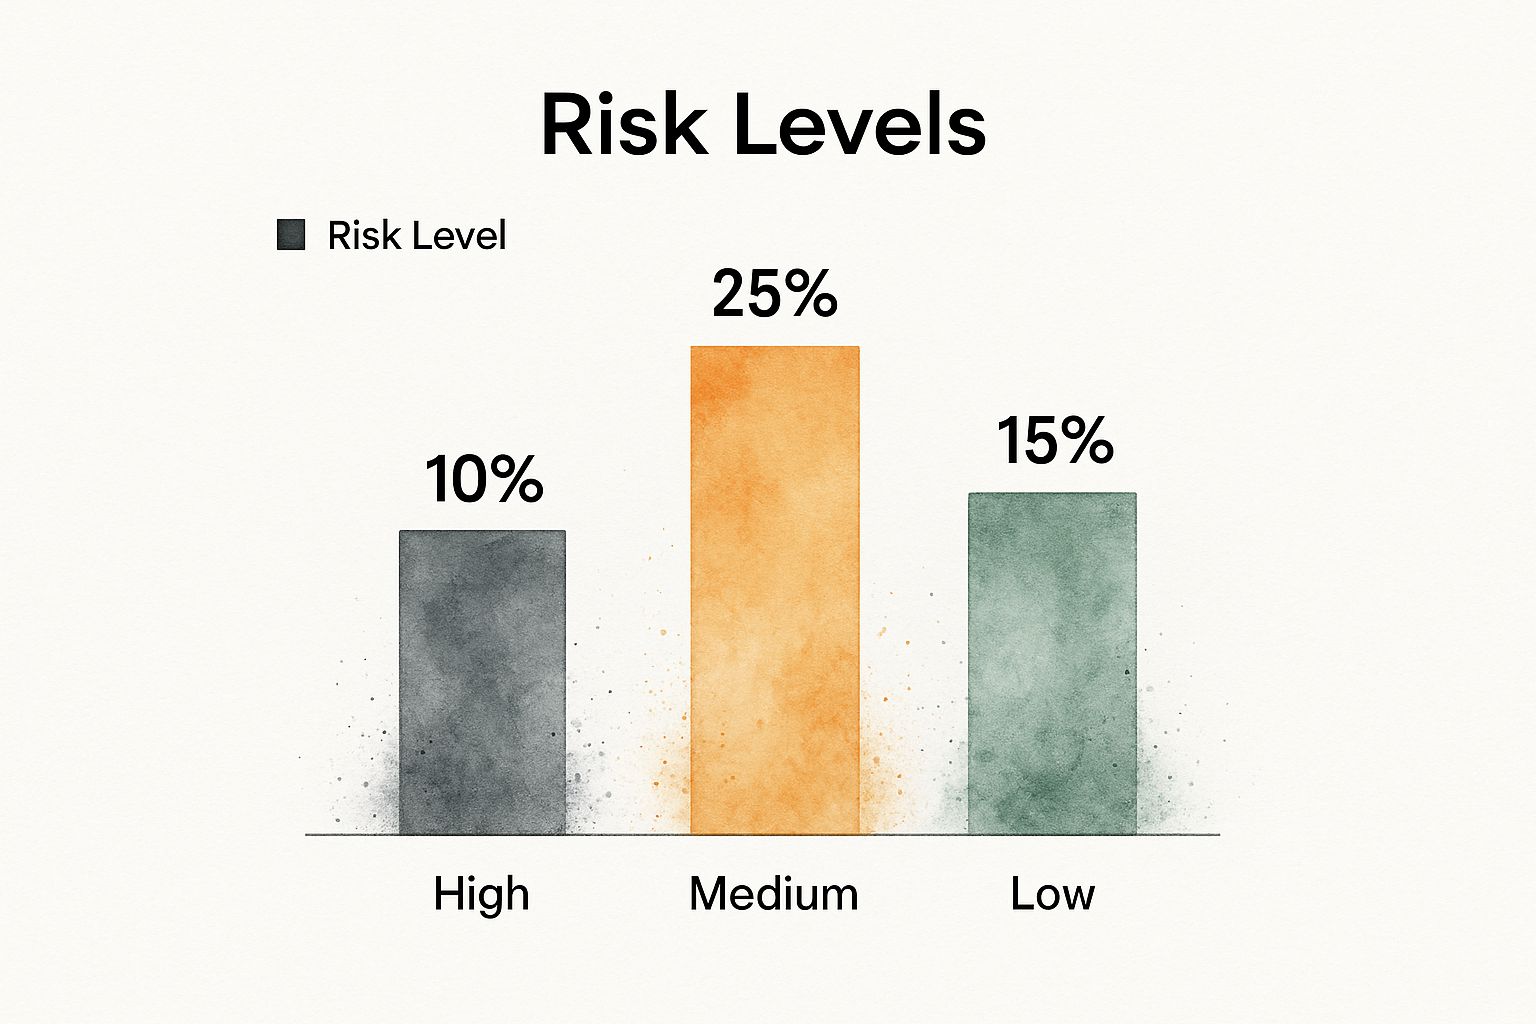
While there are only 10 “High” risk items, the 25 “Medium” risks are the ones to keep an eye on. They can grow quickly because they are connected, making them more serious fast.
Seeing Chain Reactions
To really understand these links, you need more than just lists. A Risk Interconnection Matrix can help. It shows how a risk in one area can affect others. This helps you see the whole picture, pushing you to think about the full impact of any event. By drawing these links, you can find hidden weak spots and focus your efforts where they will help the most.
The table below shows how different risk types can affect and grow each other, helping to spot where big chain reactions might start.
|
Primary Risk |
Secondary Effects |
Probability Multiplier |
Impact Areas |
|---|---|---|---|
|
Geopolitical Instability |
Supply chain disruption, trade tariff increases |
Moderate (Initial event) -> High (Combined effect) |
Operations, Finance, Strategy |
|
Cybersecurity Breach |
Data loss, reputational damage, regulatory fines |
High (Direct impact) -> Very High (Cascade) |
Legal, Marketing, IT, Finance |
|
Extreme Weather Event |
Physical asset damage, operational downtime |
Low (Predictability) -> High (Impact) |
Operations, Insurance, Human Resources |
|
Economic Downturn |
Reduced consumer demand, credit availability shrinks |
High (Broad impact) -> Very High (Combined) |
Sales, Finance, Strategy, Marketing |
This chart shows that a single event often affects more than one area. For example, a cybersecurity breach doesn’t just hit IT. It also impacts legal, marketing, and finance, making the overall risk much higher.
This connection is a key part of today’s world. A recent report from the World Economic Forum, based on insights from over 900 experts, describes a world where risks are linked together. It says that between 2025 and 2027, conflicts, extreme weather, and political division are big worries. These issues are not separate; they influence each other, creating big challenges. To find out more, you can read the full Global Risks Report 2025. This shows why any good risk assessment must consider these links.
A Simple Plan for Linked Risks
How can you use this idea? Let’s look at an example. Imagine a company that relies on one supplier in another country. Here’s how you could map the linked risks:
Main Risk (Political): Trouble starts in the supplier’s country.
Chain Reaction (Operational/Financial): This could cause new export rules, factory closures, or shipping holdups. These lead to production stops and higher freight costs.
Risk Multiplier: The political risk might seem small at first. But with added operational and financial effects, its importance grows a lot.
Affected Areas: The impact spreads to manufacturing, sales, finance, and customer relations.
By tracing these events, you can create better strategies to handle them. Instead of just watching political news, a smarter move is to diversify the supply chain by finding partners in safer regions. This way, you solve the root of the problem, not just the symptoms, making the organization stronger.
How to Make Your Report Matter
An excellent risk assessment can spot every threat with precision. But it won’t help if it just sits unread in someone’s inbox. The key step is to turn your analysis into action. A report that isn’t used is just a nice piece of paper. The real test is making your insights count.
Think of it like a doctor giving a diagnosis. The talk with the patient’s family is about the big picture and choices. The detailed report for other doctors includes lots of data and complex terms. Your plan for sharing a risk report should be just as flexible.
Adjusting Your Message for Best Results
A common mistake is sending the same long document to everyone. This approach often means your work gets ignored. Instead, make a plan that considers what each group needs to know.
For Leaders: They want to know the main points, not the details. Give them a short summary or a few slides. Focus on the top 3-5 risks, their possible impact on money and reputation, and what you recommend. Use clear visuals and talk about business outcomes to get their support.
For Managers: These are the ones who will make the changes. They need clear, actionable steps. Give them the parts of the report that matter to their work, with step-by-step instructions. They need to know “how,” not just “why.”
For Technical Teams: These experts need the data to check your findings and set up controls. They should get the full report, with all the details, data sources, and methods used.
Building Agreement and Ensuring Responsibility
Just sharing the data isn’t enough; you must get everyone to agree on what’s important. Don’t just send out the report and hope it works. Plan a workshop or a meeting to talk about the results in person. This allows people to ask questions, share worries, and decide together what to do next. This turns them from passive readers into active participants.
Once you know what to focus on, responsibility is key to success. A plan without clear roles will not work. Assign each task to a specific person or team. Set a realistic deadline and find a way to measure success. This creates a structure that ensures steady progress. A simple checklist can be very helpful.
In the end, making a report work means changing how the organization behaves. The evidence is in the results. For example, companies that regularly follow their assessments see real improvements. Regular users of some assurance methods have 54% fewer issues in later checks. This proves that a well-organized plan and review process make a company stronger and more resilient over time.
Your Risk Assessment Success Plan
Turning ideas into results is the final, most important step. This plan is your guide to building and keeping a strong risk assessment program. Think of it as a way to turn risk management from a simple task into a real advantage. The goal is to move from making one example risk assessment report to creating a constant cycle of risk awareness.
This journey happens in stages, each building on the last to create a strong and forward-thinking organization. It starts with everyone understanding the goals and grows into a mature, data-driven system.
Phase 1: Foundation and Agreement (Months 1-3)
The first phase is about setting a common base. Before building anything meaningful, you need shared goals and clear talk.
Build a Core Team: Gather key people from finance, operations, IT, and leadership. This group will drive the process.
Define Goals: What do you want to protect? What does success look like? Start small, maybe with one key business unit or product. Aim to create one high-quality report to show the value of the effort.
Choose a Framework: Pick a simple method, like a 5×5 risk matrix, to check likelihood and impact. Aim for consistency, not perfection.
Success here isn’t about complex data. It’s about creating a common way to talk about risk and getting leadership to support the vision.
Phase 2: Action and Skill Building (Months 4-9)
With a base in place, it’s time to build processes. This stage is about moving from planning to doing and growing your team’s skills.
Do Your First Assessment: Use your chosen framework within your scope. This is where your first example risk assessment report becomes real. Focus on making it clear and useful.
Grow Skills: Teach your core team and key managers how the risk assessment works. They need to feel confident finding and talking about risks in their departments.
Set Up an Action Tracker: Use a simple, central system (even a shared spreadsheet works) to assign tasks, set deadlines, and track progress. Accountability is key to ensure your report leads to real change.
Success in this phase means finishing your first full risk cycle and completing the initial actions.
Phase 3: Refinement and Integration (Months 10-18)
Once everything is running well, you can make it better and more in tune with the business. This step focuses on using data wisely and bringing risk awareness into daily work.
Add Numbers: Begin to use data in your assessments. For example, check past incident data to make your predictions more accurate or use money models to guess possible impacts better.
Link to Business Plans: Connect what you learn about risks to the yearly planning and budgeting. This ensures that risk insights guide big decisions.
Choose the Right Tools: Now that you understand your needs, you can look at technology. Find tools that make gathering data easier, improve visual displays, and help with reporting to make things more efficient.
At this point, risk assessment becomes a part of how the organization works, leading to better results and stronger resilience for future challenges.
For investors, having the right data is crucial. Stock Decisions helps by turning complex market info into clear, useful insights, so you can judge risk confidently. Learn how to make smarter choices at yourwealthsignal.com.
- Inflation and Stock Market: Your Complete Survival Guide
- How to Rebalance Portfolio Like a Pro: Real-World Strategies
- 8 Financial Modeling Best Practices to Master in 2025
- Get Your Example Risk Assessment Report – Professional & Editable Templates
- 8 Powerful Investment Analysis Methods to Master in 2025