
Your Guide to Stock Valuation
This guide explains eight basic ways to figure out how much a stock is worth, helping you make better investment choices. You will learn how to find a stock’s true value with methods like Discounted Cash Flow (DCF) analysis and Price-to-Earnings (P/E) ratios. Knowing these basic ideas is important for spotting good deals and making smart investments. We will discuss what each method does well and where it might not work as well, giving useful tips for beginners and experienced investors. Let’s look at these stock valuation methods and learn how to invest successfully.
1. Discounted Cash Flow (DCF) Analysis
Discounted Cash Flow (DCF) analysis is a basic method for figuring out what a company’s stock is worth. It works on the idea that a company’s value is the total of all its future cash flows, brought back to today’s value. This change considers that a dollar today is worth more than a dollar in the future. Many investors like DCF analysis because it gives a clear picture of a company’s financial future, rather than just relying on what the market thinks. Among different methods for valuing stocks, DCF analysis is notable for its direct way of looking at a company’s expected financial performance.
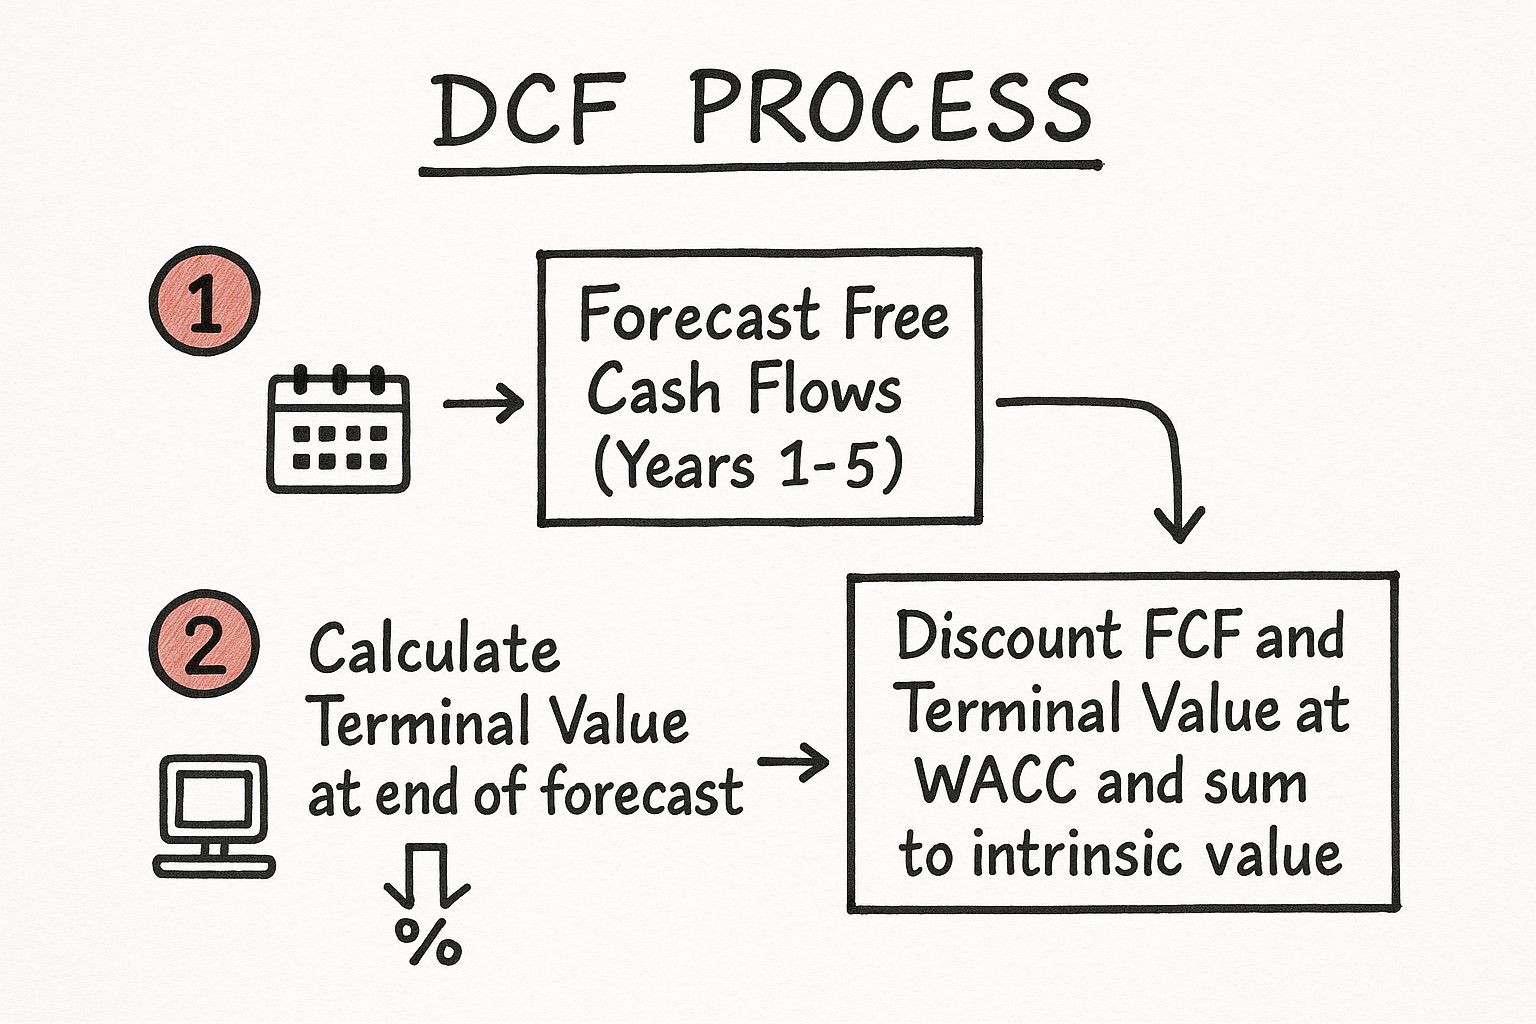
The infographic above visualizes the DCF analysis process, highlighting the key steps involved in arriving at a company’s intrinsic value. It demonstrates the flow from projecting free cash flows and calculating the terminal value to discounting these values back to the present and summing them to determine the intrinsic value.
The DCF method involves predicting a company’s future free cash flows for a set time, usually 5-10 years. This means estimating how much money the company will make, what it will spend, and how its working capital will change. After this period, a terminal value is calculated to estimate cash flows forever. The future cash flows are discounted using the weighted average cost of capital (WACC), which reflects the company’s risk. Adding up these present values and the terminal value gives the stock’s estimated intrinsic value. Each step depends on the one before it, leading to a full valuation.
Features of DCF Analysis:
Projects future free cash flows (FCF): Forecasting FCF over a specific period, usually 5-10 years, is the cornerstone of DCF analysis.
Calculates terminal value: Accounts for the company’s value beyond the explicit forecast period.
Applies a discount rate (WACC): Uses WACC to discount future cash flows back to their present value.
Sums present values: Aggregates the present values of projected FCF and terminal value to arrive at the intrinsic value.
Pros:
Forward-looking: Considers long-term future performance rather than just historical data.
Time-value sensitive: Accounts for the time value of money.
Intrinsic focus: Independent of current market prices and sentiment.
Adaptable: Applicable across various industries and growth stages.
Specific valuation: Provides a concrete intrinsic value estimate.
Cons:
Assumption sensitive: Highly dependent on input assumptions like growth rates and discount rates.
Subjectivity in forecasting: Requires significant forecasting, introducing potential biases.
Complex implementation: Can be time-consuming and require advanced financial modeling skills.
Challenges with early-stage companies: Less effective for companies with unpredictable cash flows.
Examples of Successful Implementation:
Warren Buffett: A prominent advocate of DCF analysis, using it extensively for Berkshire Hathaway’s investment decisions.
Amazon’s growth phase: DCF models consistently projected higher valuations for Amazon compared to traditional metrics like P/E ratios during its rapid growth period.
Oil and gas companies: Modified DCF models are commonly used to value reserves and production assets in the energy sector.
- DCF analysis deserves its place in any discussion of stock valuation methods due to its comprehensive nature. While it presents complexities and requires careful consideration of its limitations, when implemented correctly, it offers a powerful tool for investors seeking to understand the true value of a company.
2. Price-to-Earnings (P/E) Ratio
The Price-to-Earnings (P/E) ratio is a key method for evaluating stocks. It helps investors see how much a company’s share price compares to its earnings per share (EPS). This shows how much the market would pay for each dollar of the company’s earnings. It lets investors quickly check if a stock’s value seems high, low, or just right compared to its earnings, its industry, or its past performance. The P/E ratio can be based on past earnings over the last twelve months or on expected future earnings. This helps investors look at both past results and future growth when analyzing a stock.
The calculation is simple: Stock Price divided by Earnings Per Share. This ease, along with how easy it is to find in financial reports, makes it popular with investors. Industry benchmarks help investors compare a company’s value with its competitors. These benchmarks usually classify P/E ratios into groups like value (less than 15), fair value (15-25), and growth (more than 25), giving a quick first look at a stock’s potential.
Features and Benefits:
Simple formula: Easily calculated and understood, facilitating quick assessments.
Flexibility: Utilizes both TTM and forward earnings, accommodating different analytical perspectives.
Comparative analysis: Industry benchmarks enable relative valuation within specific sectors.
Wide availability: Accessible for most publicly traded companies with positive earnings.
Intuitive interpretation: Provides a clear indication of market sentiment towards a stock’s earnings potential.
Pros:
Easy to calculate and widely understood.
Enables comparisons across companies within the same industry.
Readily available for most public companies with positive earnings.
Offers an intuitive measure of a stock’s valuation relative to its earnings.
Streamlines initial screening of investment opportunities.
Cons:
Inapplicable to companies with negative earnings.
Doesn’t inherently account for variations in growth rates between companies.
Susceptible to distortions from accounting practices or one-time events.
Ignores a company’s capital structure and debt levels.
Less effective for cyclical businesses at peak or trough earnings.
Examples:
Value investors often seek out stocks with P/E ratios below industry averages, anticipating potential undervaluation.
High-growth companies, like Tesla during its rapid expansion phase, can maintain exceptionally high P/E ratios (often >100) reflecting market expectations for future earnings.
Apple’s P/E ratio expansion from approximately 15 to 30 between 2019 and 2021 demonstrated a shift in investor perception, signaling increased confidence in the company’s future prospects.
Tips for Effective Use:
Compare P/E ratios within the same industry or sector for meaningful insights.
Consider both trailing and forward P/E ratios to gain a comprehensive perspective.
Use the P/E ratio in conjunction with other metrics like the PEG ratio, which accounts for growth, to refine your analysis.
Examine historical P/E ranges to identify potential mean reversion opportunities.
Adjust for one-time items or extraordinary events to derive a normalized P/E ratio, providing a clearer picture of underlying performance.
The P/E ratio is important in valuing stocks because of people like Benjamin Graham and Peter Lynch, who highlighted its significance. Wall Street analysts and financial media also rely on it, making it a major tool in stock analysis. It is included in stock valuation methods because it is easy to understand and use, and it offers a fast and useful look at how a company’s market value compares to its earnings.
3. Price-to-Book (P/B) Ratio
The Price-to-Book (P/B) ratio is an important way to value a stock. It looks at a company’s market price compared to its book value. This method gives an asset-focused view of a company, which is helpful for certain industries and investment plans. It helps investors see how much they’re paying for each dollar of a company’s net assets, showing if the stock might be priced too high or too low.
How It Works:
The P/B ratio is calculated by dividing the market price per share by the book value per share. The book value represents the net asset value of a company, essentially what would be left if all assets were liquidated and all liabilities paid off. This is readily available on the balance sheet. The formula is:
Market Price per Share / Book Value per Share
Features and Benefits:
Concrete Floor Value: The P/B ratio can provide a sense of a company’s “floor” value based on its tangible assets. This is particularly relevant for asset-heavy industries like manufacturing, real estate, or utilities.
Industry Comparison: P/B is highly useful for comparing companies within capital-intensive sectors. Differences in P/B ratios can highlight potential investment opportunities or overvaluations within a specific industry.
Stability: Compared to earnings-based metrics like the Price-to-Earnings (P/E) ratio, the P/B ratio tends to be less volatile, providing a more stable valuation metric.
Applicability to Loss-Making Companies: The P/B ratio can be used even for companies with negative earnings, as long as they have positive book value. This makes it a valuable tool in situations where earnings are temporarily depressed.
Tangible Book Value: The P/B ratio can be further refined by using the tangible book value, which excludes intangible assets like goodwill and intellectual property. This is particularly relevant for analyzing companies in industries where intangible assets are difficult to value.
Pros:
Provides a concrete floor value based on tangible assets.
Useful for comparing companies within capital-intensive industries.
Less volatile than earnings-based metrics.
Works for companies with negative earnings but positive book value.
Historically effective for identifying undervalued stocks.
Cons:
Less relevant for modern knowledge-economy companies with significant intangible assets (e.g., software companies).
Book values can be distorted by accounting methods and goodwill.
Doesn’t account for future growth or earnings potential.
May overvalue companies with outdated or declining assets.
Ignores off-balance sheet items and liabilities.
Examples:
Financial institutions, particularly banks, are frequently evaluated using P/B ratios. A bank trading significantly below its book value might attract value investors.
Value investors, inspired by Benjamin Graham, have historically looked for companies trading below book value, viewing this as a margin of safety.
Insurance companies are another sector where P/B ratios are commonly used for comparison and valuation.
When and Why to Use This Approach:
The P/B ratio works best for studying companies with lots of physical assets and steady profits. It’s useful for spotting companies that might be undervalued, especially in traditional industries that need a lot of capital. It doesn’t work as well for tech companies focused on growth, but it is still important for value investing and helps understand a company’s worth compared to its assets. When combined with other ways to value businesses, it gives a better picture of a company’s financial state and investment potential. This makes it an important part of any investor’s stock valuation tools.
4. Enterprise Value-to-EBITDA (EV/EBITDA)
Enterprise Value-to-EBITDA (EV/EBITDA) is a stock valuation method that looks at a company’s worth by considering both its debt and cash, not just its equity. Unlike the price-to-earnings (P/E) ratio, which only looks at market value, EV/EBITDA includes debt and cash, making it helpful for comparing companies with different levels of debt. This metric is often used by financial experts in evaluating and valuing companies. It allows for easier comparisons between companies by removing the effects of various depreciation methods, taxes, and interest, offering a more uniform view of profitability. It compares the total value of the business to its pre-tax earnings, adjusted for non-cash expenses.
EV/EBITDA is calculated as: (Market Capitalization + Total Debt – Cash) / EBITDA. This formula reflects the total cost a potential acquirer would incur to purchase the entire business. By deducting cash, the formula acknowledges the readily available liquid assets that can offset the acquisition cost.
Pros:
Better Comparability: Ideal for comparing companies with varying capital structures and debt levels.
Removes Accounting Distortions: Provides a clearer picture of operational profitability by excluding non-cash charges and differing tax policies.
Industry Standard for M&A: A widely accepted metric in the world of mergers and acquisitions.
Suitable for Capital-Intensive Industries: Particularly useful for evaluating companies with significant depreciation expenses, like telecom and manufacturing.
Less Affected by Short-Term Earnings Fluctuations: Provides a more stable valuation measure compared to metrics heavily reliant on net income.
Cons:
Ignores Working Capital and Capex: Fails to account for the cash required for working capital and capital expenditures, which are vital for ongoing operations and future growth.
EBITDA Not a Perfect Cash Flow Proxy: While a useful indicator, EBITDA does not represent actual cash flow available to the company.
Ignores Growth Potential: Doesn’t inherently consider differences in growth rates between companies, which can significantly impact future value.
Potential Overvaluation of Aging Assets: Can overvalue companies with aging assets nearing the end of their useful life and requiring significant replacement investments.
Masks Profitability Issues: By excluding depreciation, the metric can potentially obscure underlying profitability challenges.
Examples:
Private equity firms often target companies with EV/EBITDA multiples between 6-8x, seeing these as potentially undervalued opportunities.
Media companies, such as Disney (historically trading at 9-12x EV/EBITDA), are commonly valued using this metric due to their significant intangible assets.
The telecommunications sector, characterized by high depreciation expenses, frequently utilizes EV/EBITDA for company analysis and valuation.
Popularized By:
The EV/EBITDA ratio became popular because it’s often used by investment banks and private equity firms such as KKR and Blackstone. It’s also part of Joel Greenblatt’s “Magic Formula” for investing. By using this method, you can better understand a company’s real value and make smart investment choices.
5. Dividend Discount Model (DDM)
The Dividend Discount Model (DDM) is an important way to figure out what a stock is worth. It calculates this by looking at the present value of all the future dividend payments a stock will give. The idea is that the stock’s value is the total of all future cash it will provide to shareholders, brought back to today’s value. This makes DDM a useful method for checking a stock’s value.
DDM works best for valuing established companies that pay regular dividends. Companies with a long history of steady dividend payments provide the data needed for accurate future estimates. This method ties a company’s value to the actual cash investors get, making it a practical way to assess value.
The most commonly used version of the DDM is the Gordon Growth Model. This model simplifies the calculation by assuming dividends grow at a constant rate indefinitely. The basic formula is:
Stock Value = D₁ / (r – g)
Where:
D₁: Represents the expected dividend per share one year from now.
r: Is the required rate of return for the investor. This reflects the level of risk associated with the investment.
g: Represents the constant dividend growth rate.
Features and Benefits:
Focuses exclusively on dividend cash flows, providing a clear link between dividends and valuation.
Exists in multiple variations (e.g., multi-stage DDM) to accommodate different growth patterns.
Simple to understand conceptually, making it accessible to a wide range of investors.
Less dependent on potentially manipulated accounting figures, focusing on tangible returns.
Pros:
Ideal for stable, mature companies with consistent dividend histories.
Focuses on actual returns to shareholders in the form of dividends.
Easy to grasp and apply, even for beginners.
Effective for valuing utilities, Real Estate Investment Trusts (REITs), and other income-oriented investments.
Cons:
Cannot be applied to companies that don’t pay dividends.
Highly sensitive to the chosen growth rate (g) and discount rate (r) assumptions. Small changes in these inputs can drastically alter the valuation.
Fails to incorporate the value created through reinvested earnings, which can be significant for growth companies.
Doesn’t consider share repurchases as an alternative form of returning capital to shareholders.
Often undervalues growth companies that prioritize reinvesting profits over distributing dividends.
Examples of Successful Implementation:
Procter & Gamble: With its impressive history of over 60 years of consecutive dividend increases, P&G is a prime candidate for DDM valuation.
Utility Stocks (e.g., Southern Company): Their regulated and predictable business models often lend themselves well to dividend-focused valuation.
REITs: Due to their legally mandated high dividend payout ratios, REITs are particularly well-suited to DDM analysis.
The DDM gives a useful way to figure out what dividend-paying companies are worth. By knowing both its good and bad points and using it wisely, investors can get an important view of a stock’s potential and see if it fits with their investment plans.
6. Comparable Company Analysis (CCA)
Comparable Company Analysis (CCA) is a key part of figuring out how much a company’s stock is worth compared to others. It uses the idea that companies similar to each other should have similar stock prices based on their growth chances, risks, and financial health. This makes CCA important for people like investment bankers, stock analysts, investors, and corporate teams. It’s often used in stock valuation because it is practical and common in real-world situations.
How CCA Works:
CCA involves identifying a peer group of comparable companies, analyzing their key financial metrics and valuation multiples, and then applying those multiples to the target company’s financials to derive an estimated value. The process can be broken down into the following steps:
Peer Group Identification: This critical step involves selecting companies with similar business models, industry, size, growth potential, and risk characteristics. Simply belonging to the same industry classification is insufficient; a deep understanding of the target’s operations and competitive landscape is necessary.
Financial Analysis: Key financial metrics, including revenue, earnings, EBITDA (Earnings Before Interest, Taxes, Depreciation, and Amortization), and sales, re collected and analyzed for both the peer group and the target company.
Multiple Calculation: Various valuation multiples are calculated for each peer company. Commonly used multiples include Price-to-Earnings (P/E), Enterprise Value-to-EBITDA (EV/EBITDA), and Price-to-Sales (P/S). The average, median, and range of these multiples across the peer group are then determined.
Application of Multiples: The chosen multiple(s) from the peer group are applied to the corresponding financial metric of the target company. For example, if the median EV/EBITDA of the peer group is 10x and the target company’s EBITDA is $100 million, the estimated enterprise value of the target would be $1 billion.
Qualitative Adjustments: Often, adjustments are made to account for company-specific factors that differentiate the target from its peers. These adjustments can reflect differences in growth rates, profitability margins, capital structure, or management quality.
Examples of Successful Implementation:
CCA is routinely used in a variety of financial transactions and analyses:
Investment Banking: Nearly all equity offerings and M&A transactions rely heavily on CCA to justify valuations.
IPO Valuations: The valuation of Facebook’s IPO, for instance, utilized multiples derived from comparable companies like LinkedIn, Groupon, and Zynga.
Analyst Valuations: Equity analysts frequently use CCA to value companies within their coverage universe, as exemplified by the valuation of Lyft relative to Uber using revenue and growth-adjusted multiples.
When and Why to Use CCA:
CCA is particularly useful in the following scenarios:
Limited Financial History: For young companies with limited historical financial data, CCA offers a valuable way to estimate value based on the market’s assessment of comparable businesses.
Market-Based Valuation: When a market-based valuation is required, CCA provides a direct link to prevailing market sentiment and industry trends.
Quick Valuation Estimate: Compared to more complex intrinsic valuation methods like Discounted Cash Flow (DCF) analysis, CCA offers a relatively quick and straightforward approach.
Pros and Cons of CCA:
Pros:
Based on actual market values, reflecting current market conditions.
Relatively simple to implement.
Incorporates market sentiment and industry trends.
Useful for companies with limited financial history.
Provides a range of potential values.
Cons:
Assumes efficient market pricing of peer companies, which may not always be the case.
Difficulty in finding truly comparable companies.
Results heavily dependent on peer group selection.
Can perpetuate market mispricing’s.
Less effective during market extremes.
By understanding the mechanics, applications, and limitations of CCA, investors and analysts can effectively leverage this powerful stock valuation method to gain valuable insights into a company’s worth in the context of the broader market.
7. Price-to-Sales (P/S) Ratio
The Price-to-Sales (P/S) ratio is an important way to value stocks that every investor should know. It helps to look at companies, especially when earnings-based measures like the Price-to-Earnings (P/E) ratio don’t work well. This ratio compares a company’s market value to its total sales, showing how much the market is willing to pay for each dollar of sales. It gives a view of how valuable a company’s ability to make money is seen. It’s a helpful tool for valuing stocks because it lets investors look at companies regardless of how much profit they make.
How it Works:
The P/S ratio is calculated in two primary ways:
Market Capitalization / Annual Revenue: This provides a company-wide perspective.
Price per Share / Revenue per Share: This offers a per-share perspective, often easier for individual investors to grasp.
Calculations can use past year revenue for a look at history or future sales estimates for a look ahead. This information is easy to find for almost all public companies, making the P/S ratio a simple stock valuation method. P/S ratios usually range from less than 1 for businesses with low profits (like retail) to more than 10 for tech companies with high growth and profits. One key aspect of the P/S ratio is its lower swings compared to earnings-based metrics, providing a steadier view, especially during market changes.
When and Why to Use P/S Ratio:
The P/S ratio is particularly useful in the following scenarios:
Unprofitable or Pre-profit Companies: When earnings are negative or non-existent, the P/E ratio is inapplicable. The P/S ratio, however, provides a valuable alternative for assessing companies in their early stages or those pursuing aggressive growth strategies.
Companies with Temporary Earnings Issues: Companies facing short-term headwinds impacting earnings can still be evaluated using the P/S ratio, providing a more consistent measure of their underlying business value.
Comparing Companies at Different Profitability Stages: The P/S ratio allows for comparisons across companies at different stages of maturity, even if they have vastly different profitability profiles.
Pros:
Applicability to unprofitable companies.
Less susceptible to accounting manipulations than earnings metrics.
More stable than earnings-based metrics.
Useful for companies with temporary earnings issues.
Facilitates comparisons across different profitability stages.
Cons:
Ignores profitability, margins, and efficiency differences. Two companies with the same P/S ratio may have drastically different profit margins, impacting their intrinsic value.
Less relevant for comparing companies with different business models. A high P/S ratio might be justified for a SaaS company with recurring revenue but not for a traditional retailer.
Does not account for debt levels or capital structure. A highly leveraged company may appear undervalued based on P/S alone.
Can lead to overvaluation of high-revenue, low-profit businesses. Revenue growth doesn’t necessarily translate to shareholder value if profits are lagging.
Highly industry-specific. “Good” P/S ratios vary significantly across sectors.
Examples:
Amazon: Traded at P/S ratios of 2-4x during its high-growth phase, even with minimal profits, reflecting investor confidence in its revenue generation and future potential.
SaaS Companies: Often trade at 10-20x sales due to high margins and recurring revenue models.
Snap Inc.: Relied heavily on the P/S ratio during its IPO process when the company was unprofitable.
By understanding the nuances of the P/S ratio and applying it judiciously, investors can gain valuable insights into a company’s valuation, especially when traditional earnings-based metrics are unavailable or unreliable. Used in conjunction with other stock valuation methods, the P/S ratio can strengthen investment decision-making.
8. Sum-of-the-Parts (SOTP) Analysis
Sum-of-the-Parts (SOTP) analysis is a stock valuation method that looks at a company’s value by examining each part separately. This is especially useful for businesses with different divisions, as it gives a clearer picture of their worth than looking at the company as a whole. SOTP is a key tool for investors who want to understand a company’s real value.
Instead of seeing a company as a single unit, SOTP divides it into separate business segments or assets. Each part is then valued on its own using the best method, which might include Discounted Cash Flow (DCF) or comparing with similar companies. The total value is the sum of these individual values, minus corporate costs and debts. This method recognizes that different parts of a business may need different valuation approaches, depending on their growth potential, risks, and industry characteristics.
How SOTP Works:
Identify Business Segments: Clearly define the distinct operating segments or assets within the company. This might include product lines, geographical regions, or separate subsidiaries.
Value Each Segment: Apply the most relevant valuation method to each segment. For example, a high-growth technology division might be best suited for DCF analysis, while a mature manufacturing unit might be valued using comparable company multiples.
Sum the Values: Add together the individual segment valuations.
Adjust for Corporate Items: Subtract corporate overhead, unallocated expenses, and net debt to arrive at the overall enterprise value.
Account for Synergies/Dissynergies: Consider any synergies or dissynergies between business segments, adjusting the valuation accordingly. Synergies add value, while dissynergies subtract value.
Probability-Weighted Scenarios: For assets with uncertain outcomes, such as drug pipelines in pharmaceutical companies, incorporate probability-weighted scenarios to reflect the range of potential outcomes.
Examples of SOTP Implementation:
General Electric: Activist investors successfully argued for breaking up GE into separate businesses based on SOTP analysis, highlighting the conglomerate discount applied to the combined entity and the potential for unlocking value through independent operations.
Berkshire Hathaway: Given its diverse holdings in insurance, utilities, railroads, and manufacturing, Berkshire Hathaway is often valued using SOTP, reflecting the distinct nature of its subsidiaries.
Disney: Media conglomerates like Disney benefit from SOTP valuation as it allows for separate assessments of theme parks, film studios, streaming services, and other entertainment assets, each with its own growth trajectory and market dynamics.
Pros of SOTP Analysis:
Recognizes Nuances: Acknowledges that diverse businesses warrant distinct valuation approaches and multiples.
Uncovers Hidden Value: Can reveal undervalued segments masked by consolidated financials.
Informs Strategic Decisions: Useful for evaluating potential spin-offs, divestitures, or mergers and acquisitions.
Enhanced Accuracy: Provides a more precise valuation for complex businesses than single-metric methods.
Cons of SOTP Analysis:
Data Intensive: Requires detailed segment-level financial information, which may not always be publicly available.
Complex and Time-Consuming: Implementing SOTP rigorously can be a complex and time-consuming process.
Sensitivity to Assumptions: Highly dependent on the accuracy of assumptions made for each business unit.
Overestimation Risk: May overestimate value if corporate overhead or integration costs are underestimated.
SOTP analysis, while complex, offers a valuable tool for stock valuation, especially for diversified companies. By meticulously valuing each part of the business and considering the interplay between them, investors can gain a more nuanced understanding of a company’s true potential and identify opportunities where the market may be mispricing the stock. This detailed approach makes SOTP a valuable addition to any investor’s toolkit.
Key Metrics Comparison of 8 Stock Valuation Methods
|
Valuation Method |
Implementation Complexity 🔄 |
Resource Requirements 💡 |
Expected Outcomes 📊 |
Ideal Use Cases 💡 |
Key Advantages ⭐ |
|---|---|---|---|---|---|
|
Discounted Cash Flow (DCF) |
High 🔄🔄🔄 (complex forecasting & modeling) |
High 💡 (requires detailed financial data and assumptions) |
Precise intrinsic value estimate 📊⭐⭐ |
Mature companies with predictable cash flows; detailed analysis |
Accounts for time value of money; adaptable; long-term view ⭐⭐⭐ |
|
Price-to-Earnings (P/E) Ratio |
Low 🔄 (simple calculation) |
Low 💡 (readily available market data) |
Quick relative valuation 📊⭐ |
Profitable companies within same industry; screening |
Easy to calculate and compare; widely understood ⭐⭐⭐ |
|
Price-to-Book (P/B) Ratio |
Low to Moderate 🔄🔄 (simple calculation, some accounting nuance) |
Low to Moderate 💡 (balance sheet data needed) |
Asset-based valuation baseline 📊⭐ |
Asset-heavy industries; financial institutions |
Provides tangible asset floor value; works if earnings negative ⭐⭐ |
|
EV/EBITDA |
Moderate 🔄🔄 (adjusts for capital structure) |
Moderate 💡 (market cap, debt, cash, EBITDA data) |
Capital structure-neutral comparison 📊⭐⭐ |
Capital-intensive industries; M&A analysis |
Neutralizes debt effects; useful across leverage profiles ⭐⭐⭐ |
|
Dividend Discount Model (DDM) |
Moderate 🔄🔄 (requires dividend and growth forecasting) |
Moderate 💡 (dividend history and growth assumptions) |
Intrinsic value based on dividends 📊⭐ |
Mature, dividend-paying companies |
Focuses on actual shareholder returns; intuitive ⭐⭐ |
|
Comparable Company Analysis |
Moderate 🔄🔄 (data gathering and peer selection) |
Moderate 💡 (need peer group financials and multiples) |
Market-based valuation range 📊⭐⭐ |
Companies with comparable public peers |
Reflects current market sentiment; flexible and widely used ⭐⭐ |
|
Price-to-Sales (P/S) Ratio |
Low 🔄 (simple ratio) |
Low 💡 (sales data broadly available) |
Revenue-based valuation proxy 📊⭐ |
Early-stage or unprofitable companies |
Applicable to no-earnings firms; stable metric ⭐⭐ |
|
Sum-of-the-Parts (SOTP) |
Very High 🔄🔄🔄🔄 (segment valuation & aggregation) |
Very High 💡 (segment data and multiple valuation methods) |
Combined value of diverse assets 📊⭐⭐ |
Conglomerates, holding companies, diversified businesses |
Identifies hidden value; precise for complex firms ⭐⭐⭐⭐ |
Mastering Stock Valuation: A Path to Informed Investing
Understanding how to value stocks is important for anyone wanting to deal with the market’s complexities. Basic methods like Discounted Cash Flow (DCF) analysis and measures like the Price-to-Earnings (P/E) and Price-to-Book (P/B) ratios, along with more detailed methods like the Dividend Discount Model (DDM) and Sum-of-the-Parts (SOTP) analysis, each give a different way to look at a company’s value. We have looked at the pros and cons of eight main stock valuation methods, including the common Enterprise Value-to-EBITDA (EV/EBITDA) and Price-to-Sales (P/S) ratios, and what we learn from Comparable Company Analysis (CCA). The main point is that knowing these methods well helps investors make better decisions.
Getting good at these stock valuation methods is not just about crunching numbers; it is about understanding a business’s real value and its future growth potential. By using different valuation methods and looking at both numbers and other factors, investors can find undervalued stocks and avoid risks. This smart approach is key to doing well in the stock market, whether you want to grow your money or earn income.
Want to try these stock valuation methods? Use Stock Decisions, a platform with data and tools to help you value stocks better. Visit Stock Decisions to start making better investment choices today.